Real-Time Queues View Programmability
You can customize the Real-Time Queues View to display the queue statistics that you want to monitor in your contact center.
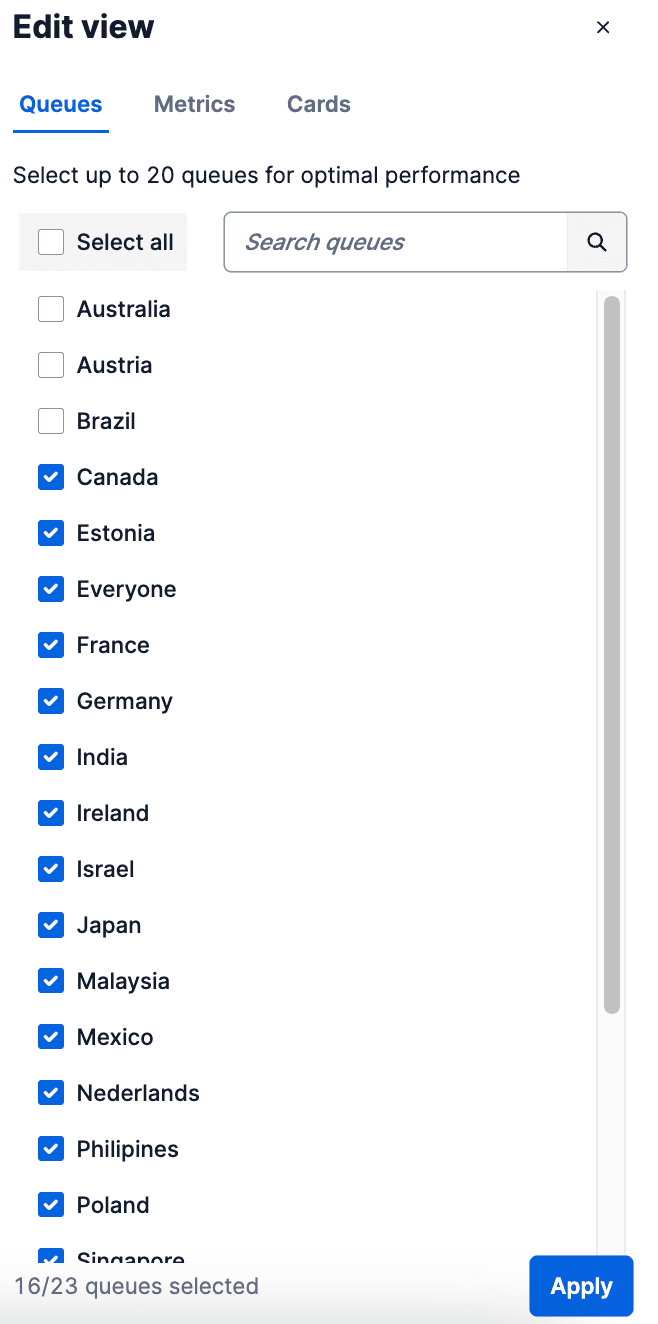
In Flex UI 2.4.0 and later, you can use the Edit view option to filter your view to just the queues and metrics that you want to monitor.
The Edit view panel opens automatically when you access the Real-Time Queues View page for the first time.
Once you've selected your view settings, they're saved in your web browser. Your settings remain saved even if you close the browser, log out, or delete cookies or browser history. However, if you use a different web browser, you must select your settings again in that browser.
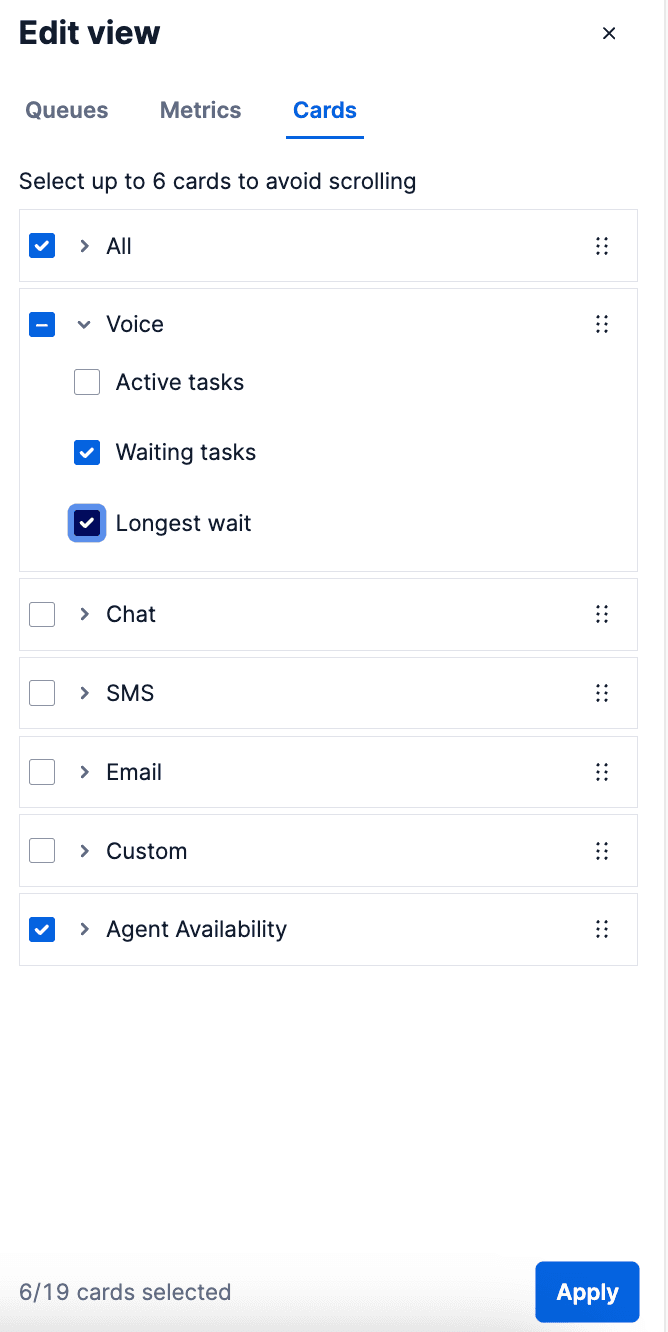
In Flex UI 2.5.0 and later, you can choose which summary metrics to highlight in the cards that appear above the table.
On the Edit view > Card tab, select the cards that you want to see. To avoid horizontal scrolling, select 6 or fewer cards. To change the display order, click the 6-dots icon on the right side of the metric category name and drag it up or down the list.

View using RealTimeQueues to learn more about using the QueuesStatsView component programmatically.
To filter your queues, navigate to Edit view > Queues and select the queues that you want to see on this page. Use the search field to quickly find queues. When you're done, click Apply to save your changes.
-
Select 20 or fewer queues to avoid performance or latency issues.
- If you have 20 or fewer queues in your account, they're all selected by default.
- If you have more than 20 queues, the first 20 are selected automatically.
-
Only active queues are shown.

On the Edit view > Metrics tab, select the metrics that you want to view and monitor. When you're done, click Apply to save your changes.
-
Select 8 or fewer metrics. This best practice helps your users avoid horizontal scrolling.
-
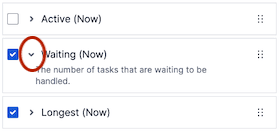
To see a description of a metric, click the arrow next to the metric name.

-
Change the order in which the metrics display by clicking the 6-dots move icon and dragging it up or down the list. The metrics table automatically updates to match the order of the metrics in the Edit view list.
-
If you upgraded to Flex UI 2.4.x or later from an earlier version, the new metrics will appear on the dashboard after your Flex account receives at least one call, SMS, or chat task post-upgrade.
The Real-Time Queues View is rendered by the QueuesStatsView component. This programmable Flex UI component contains the following child components:
QueuesStats.AggregatedQueuesDataTiles(key:tiles)QueuesStats.QueuesDataTable(key:table)
You can modify QueuesStatsView with the Content property:
1// Add your own component2QueuesStatsView.Content.add(<CustomTiles key="custom-tiles" />, {3sortOrder: 0,4});
1import * as Flex from "@twilio/flex-ui";2import { connect } from "react-redux";34// Add the WrappingTasksTile to the view5Flex.QueuesStats.AggregatedQueuesDataTiles.Content.add(6<WrappingTasksTile key="wrapping-tasks-tile" />,7{ sortOrder: -1 }8);
You can also use the QueueStatsView component to programmatically remove a tile.
To remove a tile:
1flex.QueuesStats.AggregatedQueuesDataTiles.defaultProps.dataTileFilter = (2id3) => {4if (id === "agents-by-activity-chart-tile") {5return false; // false means the card will be hidden6}7return true; // true means the card will be shown8};
The default tiles for this component are agents-by-activity-chart-tile and all. Note that built in channel-specific tiles use the task channel SID.
The child component QueuesStats.QueuesDataTable lets you add columns in the QueuesDataTable. Out of the box, the QueuesDataTable has the following columns:
- Queues (key:
friendly-name) - Active (key:
active-tasks) - Waiting (key:
waiting-tasks) - Longest (key:
longest-wait-time) - Agents (key:
agents)
To add a column, add a ColumnDefinition component to QueuesStats.QueuesDataTable. If you want custom formatting on a default column, remove the original column and create a new one.
1import { ColumnDefinition } from "@twilio/flex-ui";23// Create a new column with custom formatting4Flex.QueuesStats.QueuesDataTable.Content.add(5<ColumnDefinition6key="my-waiting-tasks"7header="Waiting tasks"8content={(queue: Flex.QueuesStats.WorkerQueue) => {9// Calculate number of waiting tasks by adding pending and reserved10const { pending, reserved } = queue.tasks_by_status;11const waitingTasks = pending + reserved;1213// Set the style to color: red if # of waiting tasks is > 1014const spanStyle = waitingTasks > 10 ? { color: "red" } : {};1516// Return the element to render17return <span style={spanStyle}>{waitingTasks}</span>;18}}19/>,20{ sortOrder: 1 } // Put this after the second column21);
Warning
The defaultSortColumn and sortDirection properties are only available in
@twilio/flex-ui@1.19.0 and later.
Sorting capabilities are only available in
@twilio/flex-ui@1.14.0 and later.
You can click on the header of a predefined column to sort the QueuesDataTable by those values. By default, the table is sorted by queue name.
To change the column the table is sorted by, set the following property to the key of the column that you want to use:
QueuesStats.QueuesDataTable.defaultProps.defaultSortColumn = "column-key";
When adding a custom column, you can specify the parameter sortingFn: (a, b) => number, which works the same way as the compareFunction parameter in JavaScript's Array.sort().
The default order of sorting is descending. To change the direction to ascending, use the sortDirection property on the ColumnDefinition component.
Warning
If you change the order by inverting the value returned from sortingFn, the
visualization in the column header won't display correctly.
In this example, you display a new column with pending tasks and allow sorting by the values in this column:
1Flex.QueuesStats.QueuesDataTable.Content.add(2<ColumnDefinition3key="pending-tasks"4header="Pending tasks"5content={(queue: Flex.QueuesStats.WorkerQueue) =>6queue.tasks_by_status.pending7}8sortingFn={(9a: Flex.QueuesStats.WorkerQueue,10b: Flex.QueuesStats.WorkerQueue11) => a.tasks_by_status.pending - b.tasks_by_status.pending}12sortDirection="asc"13/>14);
Warning
Filtering is only available in @twilio/flex-ui@1.14.0 and later. Subscription filters are available in @twilio/flex-ui@1.24.0 and later.
Out of the box, all of your queues display in the Flex UI. If you want to hide queues or only show specific queues, you can apply a filter:
1QueuesStats.setFilter(2(queue: Flex.QueuesStats.WorkerQueue) =>3queue.friendly_name !== "Invisible Queue"4);
The setFilter takes a single parameter, a filter function with a signature of (queue: WorkerQueue) => boolean. This function will be evaluated for each queue and added to the view if the return value is true.
For larger contact centers with a large number of queues, it may be more adequate to use the setSubscriptionFilter that is available in @twilio/flex-ui@1.24.0 with the SLA feature enabled. Unlike setFilter, this filter will stop the UI from subscribing to updates from hidden queues, which results in improved performance of the page.
Warning
We recommend to subscribe to 100 or less queues for optimal performance. Subscribing to a high number of queues may be demanding on user internet connectivity and hardware.
The setSubscriptionFilter lets you filter queues only by name or SID:
1const visibleQueues = ["Everyone", "Sales"];23QueuesStats.setSubscriptionFilter(4(queue: { friendly_name: string, sid: string }) =>5visibleQueues.includes(queue.friendly_name)6);
Warning
Both filters don't affect the numbers in the global numbers of available
agents. However, using a filter might cause a discrepancy between the number
of agents in individual queues in the QueuesDataTable and the global number
of available agents in the Agents panel.
Warning
This feature is in Public Beta and available in @twilio/flex-ui@1.27.0 and later.
The SLA metrics feature adds the following columns to Flex.QueuesStats.QueuesDataTable:
- SLA 30 min (key:
sla-30min) - SLA Today (key:
sla-today) - Handled 30 min (key:
handled-tasks-30min) - Handled Today (key:
handled-tasks-today - Abandoned 30 min (key:
abandoned-tasks-30min) - Abandoned Today (key:
abandoned-tasks-today)
SLA metrics are calculated by both the last 30 minute floating window and the current business day.
After the feature is enabled, you can remove any of the default columns listed above or add additional columns with SLA metrics. See the full list of available metrics.
1const RenderShortAbandoned30Min = (2workerQueue: Flex.QueuesStats.WorkerQueue3) => (4// QueuesDataTableCell component helps us render additional expandable rows with channel specific data5<Flex.QueuesStats.QueuesDataTableCell6// Pass the queue data down7queue={workerQueue}8// Render the queue level value9renderQueueData={(queue) => queue.sla_30_min.short_abandoned_tasks_count}10// Render a value for each active channel in the queue11renderChannelData={(channel, queue) =>12channel.sla_30_min.short_abandoned_tasks_count13}14/>15);1617const RenderShortAbandonedToday = (18workerQueue: Flex.QueuesStats.WorkerQueue19) => (20<Flex.QueuesStats.QueuesDataTableCell21queue={workerQueue}22renderQueueData={(queue) => queue.sla_today.short_abandoned_tasks_count}23renderChannelData={(channel, queue) =>24channel.sla_today.short_abandoned_tasks_count25}26/>27);2829Flex.QueuesStats.QueuesDataTable.Content.add(30<Flex.ColumnDefinition31key="short-abandoned-30min"32header="Short Abandoned"33// Since our columns have the same header, we can set34// the same headerColSpanKey on both to merge their headers.35headerColSpanKey="short-abandoned"36subHeader="30 min"37content={RenderShortAbandoned30Min}38/>39);4041Flex.QueuesStats.QueuesDataTable.Content.add(42<Flex.ColumnDefinition43key="short-abandoned-today"44header="Short Abandoned"45headerColSpanKey="short-abandoned"46subHeader="Today"47content={RenderShortAbandonedToday}48/>49);
In this snippet, Flex adds two columns to QueuesDataTable that show the number of short abandoned tasks in the last 30 minutes and for the day. You can use the QueuesDataTableCell in the content render function to add additional expandable rows of channel-specific data.
You can configure the time a new business day starts and all SLA threshold values in the admin plugin or with the Flex Configuration API. There are three levels of SLA configurations:
defaultqueue_configurationsqueue_channel_configurations
Each lower level overrides the one above it. For example, a queue_configurations object has priority over the default configuration and a queue_channel_configurations object has priority over the default configuration and matching queue_configurations object.
The request body is validated by the Flex Configuration API and must adhere to the following requirements:
-
Each request must include the
defaultconfiguration, even if you setqueue_configurationsand/orqueue_channel_configurationsin the same request. -
Each configuration object included in the request must contain all required properties. The required properties for each configuration object type are as follows:
-
defaultservice_level_thresholdshort_abandoned_thresholdreset_timezonereset_time
-
queue_configurationsqueue_sidreset_timezonereset_time
-
queue_channel_configurationsqueue_sidchannel_sidservice_level_thresholdshort_abandoned_threshold
-
After you submit a configuration change, your changes are not applied until the next time a task is received. Consider creating a test task to ensure that your changes are applied right away.
Changes to reset_time can cause unexpected results for Today metrics
When you update reset_time, your update might cause Today metrics to show
more than 24 hours of data. If the current reset time is 5:00 AM and you
update it to 7:00 AM, but no tasks come in until 8:00 AM, the day won't reset
at 7:00 AM because your change didn't take effect. As a result, the Today
metrics will show 26 hours of data, from 5:00 AM through 7:00 AM the next day.
1# Any change to configuration will take approximately 10 min to reflect.2# New task has to land in the queue or channel with a new configuration in order to see the change.3# For the list of possible timezones see: https://en.wikipedia.org/wiki/List_of_tz_database_time_zones45curl -X POST https://flex-api.twilio.com/v1/Configuration \6-u ACxxx:your_auth_token \7-H 'Content-Type: application/json' \8-d '{9"account_sid": "ACxxx",10"queue_stats_configuration": {11"default": {12"service_level_threshold": "20",13"short_abandoned_threshold": "5",14"reset_timezone": "GMT",15"reset_time": "08:00"16},17"queue_configurations": [18{19"queue_sid": "WQxxx",20"reset_timezone": "GMT",21"reset_time": "08:00"22}23],24"queue_channel_configurations": [25{26"queue_sid": "WQxxx",27"channel_sid": "TCxxx",28"service_level_threshold": "20",29"short_abandoned_threshold": "5"30}31]32}33}'
The WorkerQueue data object is extended with the sla_30_min and sla_today keys. These keys are both of the type WorkerQueueSLA, which contains all available SLA metrics for queues:
total_tasks_counthandled_tasks_counthandled_tasks_within_sl_threshold_counthandled_tasks_within_sl_threshold_percentageshort_abandoned_tasks_countshort_abandoned_tasks_percentageabandoned_tasks_countabandoned_tasks_percentageflow_out_tasks_countflow_out_tasks_percentagesla_percentage
If a queue handles multiple channels, the SLA data is also available per channel. The channels key on the WorkerQueue contains an array of WorkerQueueChannel, which has the following keys:
sidunique_namefriendly_namesla_30_min(WorkerQueueSLA)sla_today(WorkerQueueSLA)
workerQueue.channels[0].sla_30_min.total_tasks_count;
Warning
This feature is only available in @twilio/flex-ui@1.20.0 and later.
1Flex.QueuesStats.QueuesDataTable.Content.add(2<Flex.ColumnDefinition3key="custom-column-1"4header="My Column"5headerColSpanKey="my-column"6subHeader="Foo"7content={YourContentRenderer1}8/>9);1011Flex.QueuesStats.QueuesDataTable.Content.add(12<Flex.ColumnDefinition13key="custom-column-2"14header="My Column"15headerColSpanKey="my-column"16subHeader="Bar"17content={YourContentRenderer2}18/>19);
You can add subheaders to columns using a subHeader property on ColumnDefinition.
If adjacent columns have the same header and you want to merge these table header cells, set the same headerColSpanKey on these columns.
Warning
The full screen view is only available in @twilio/flex-ui@1.14.0 and later.
To display queue statistics on a TV or a monitor, use the full screen view by clicking the small button in the bottom-right corner.
The button is hidden by default. To enable the button, set the following property:
QueuesStatsView.fullscreen.enabled = true;