Microvisor Remote Debugging
Microvisor Public Beta
Microvisor is in a pre-release phase and the information contained in this document is subject to change. Some features referenced below may not be fully available until Microvisor's General Availability (GA) release.
Remote debugging allows you to use your development computer to probe your application while it is running on a Microvisor-based device — and to do so across the Internet. Your device may be on your desk in front of you, or installed at a test site on the other side of the world, but wherever your development device is situated, Microvisor remote debugging allows you to connect to it using the popular debugger GDB to set breakpoints, examine variables, view memory, and enumerate the call stack.
Debugging a Microvisor-enabled device remotely is functionally the same as working with the device connected directly to your development machine, and just as secure. Remote debugging sessions use end-to-end encryption using keys you generate. Your public key, passed to Microvisor within your application bundle, is used to encrypt application state data which is decrypted locally with your private key.
This guide will show you how to set up remote debugging and initiate a debugging session. For developers new to GDB, it also includes an introduction to the commands you will use to debug your app.
Info
Remote debugging is available however you connect your Microvisor-enabled product to the Internet. During development you may prefer to connect via WiFi or Ethernet to minimize latency. For more information on switching to these transports, please see the Microvisor Nucleo Connectivity Guide.
Warning
In its pre-release form, Microvisor remote debugging does not support every GDB command or feature. Some have yet to be implemented, and others are not expected to be implemented by Microvisor's GA release. To learn more, please see Supported GDB Functions.
Info
If you have not yet done so, please first work through the Microvisor Nucleo Development Board getting started guide. This will help you set up your development environment with the required software, and show you how to build and deploy Microvisor-hosted applications via the Microvisor cloud.
Warning
At this stage in Microvisor's release schedule, we support Ubuntu 20.04 LTS Linux as a primary development environment. We hope to support other platforms in due course, but for now Windows and macOS users will have to choose between interacting with the Microvisor development tools through Docker or from within a virtual machine running Ubuntu.
Info
This first part of this guide focuses on using Microvisor remote debugging from the command line. You might instead prefer to use Microsoft Visual Studio Code, an IDE that, with a little setup, can host remote debugging sessions too. If you'd like to work with VSCode, jump to the configuration instructions and then go direct to the general debugging section.
To install the appropriate version of GDB, open Terminal and enter this command:
sudo apt install gdb-multiarch
Clone our demo code repository:
git clone --recurse-submodules https://github.com/korewireless/Microvisor-Demo-Remote-Debug
Switch to the microvisor-remote-debug-demo directory if you're not already in it and run:
1twilio microvisor:deploy . --devicesid $MV_DEVICE_SID --log \2--privatekey ~/prv-key.pem \3--publickey ~/pub-key.pem
The bundled script will build the demo app, upload it to the Microvisor cloud, and assign it to your device.
Open a new terminal tab or window and enter the following command:
twilio microvisor:debug $MV_DEVICE_SID ~/prv-key.pem
The command opens a secure channel between the device and the plugin, which operates as a GDB server. You'll see the following line appear:
GDB server listening on port 8001
Keep this tab or window open. The plugin shouldn't exit to the shell prompt unless you close it down manually, or GDB exits. If the plugin does exit to the shell outside of these circumstances, review the Troubleshooting section.
In a new, third terminal window, switch to the project directory and run GDB:
gdb-multiarch -l 10 ./build/demo/mv-remote-debug-demo.elf
You should see a line indicating that GDB is reading symbols from your application .elf file. The .elf file is output by the compilation process and is located alongside the files used to generated Microvisor App bundles.
Info
The repo includes a .gdbinit file to set up the debugger. However, you'll need to allow GDB to access it. GDB will give you instructions.
The file contains these commands:
1target remote localhost:80012set remotetimeout 10
The first line points GDB at the server provided by the Microvisor Plugin. The second line increases the timeout GDB applies before ignoring any subsequent response from the current command. This is handy when you're debugging over the Internet — see the Latency section, below.
If you don't want GDB to use the init file, you can issue the above commands manually after you run GDB.
Optionally, flip back to the window you opened in Step 2. You'll see a line like:
Accepted connection from ::ffff:127.0.0.1:51254
This too shows that GDB and the Microvisor cloud are now in communication.
Info
By default, the connection between the twilio tool and GDB occurs over port 8001. You can change this by adding the --listen-port flag to the twilio microvisor:debug call and specifying an alternative port number. Make sure you tell GDB to use the new port number. Do so by entering target remote localhost:<NEW_PORT_NUMBER> at the (gdb) prompt or editing the .gdbinit file.
If you see GDB report localhost:8001: Operation timed out, or the twilio command issues GDB server listening on port 8001 but then exits to the shell, then a connection could not be made to the device. Check that it is online. If it is, then the specified device is most likely running an application from an uploaded bundle that lacked a remote debugging authorization key. First try rebooting the device: it may not yet have received the updated code you uploaded.
If twilio is still exiting to the prompt, check that you correctly passed the public key .pem file to Bundler as shown above. If not, add it now, and upload the new bundle .zip file to the Microvisor Cloud.
You should expect some latency between issuing commands to GDB and their outcomes being reported. Even if you are debugging a device close to you, your instructions are still relayed over your Internet connection to the Microvisor cloud and then back down to the device, and the responses returned along the same path.
As we continue to develop Microvisor's remote debugging functionality within the Microvisor kernel, in the Microvisor cloud, and in our desktop tools, we expect latency to improve, but remote debugging will never be as immediately responsive as debugging over a direct connection. However, this is a small price to pay for the flexibility of being able to debug Internet-connected devices wherever they may be located.
During development, especially if you are single-stepping through your code, you may prefer to connect via WiFi or Ethernet to minimize latency. For more information on switching to these transports, please see the Microvisor Nucleo Connectivity Guide.
Microvisor has no awareness of, or sensitivity to, your RTOS' threads, so thread-specific information can't be relayed to GDB, and GDB can't provide thread-level control. In this regard, GDB behaves as it your app stack — RTOS, app, middleware — is single-threaded.
Info
If you're running our FreeRTOS demo code, you'll see the Nucleo board's USER LED will stop flashing when the application is suspended, and flash again following the c or r commands.
GDB is a powerful application, and providing a full guide to its workings is beyond of the scope of this short tutorial. If you're new to GDB, here are some common operations you're likely to want to perform. The commands that trigger them are all issued at the (gdb) prompt.
You can find the official GDB documentation here.
Breakpoints allow you to halt your code at key points and inspect its state. While the application is suspended, you can view the current value of variables, and can even give them new values. This can help you understand why the application is behaving the way it is at that point, especially if it's not behaving the way you expect.
You set a breakpoint by entering the b command followed by a line number. For example, b 82 sets a breakpoint at line 82 in your source code, and the application will halt when it reaches that line. If your application's source code spans multiple files, you'll need to include the file name too: for example, b main.c:82.
1(gdb) b main.c:822Breakpoint 1 at 0x800c128: file /home/smitty/microvisor-remote-debug-demo/demo/main.c, line 82.3Note: automatically using hardware breakpoints for read-only addresses.
You can also set a breakpoint at the start of a specific function with the form b <FUNCTION_NAME>.
To view the breakpoints you have set, use the info command: info breakpoints.
1(gdb) info breakpoints2Num Type Disp Enb Address What31 breakpoint keep y 0x0800c128 in main at /home/smitty/microvisor-remote-debug-demo/demo/main.c:824breakpoint already hit 2 times52 breakpoint keep y 0x0800c568 in http_process_response at /home/smitty/microvisor-remote-debug-demo/demo/main.c:335
When the application hits a breakpoint it will suspend automatically, but you can trigger suspension at any time manually: just hit ctrl-c, which outputs:
Program received signal SIGINT, Interrupt.
In both cases, you'll then see the (gdb) prompt so you can enter commands. To continue running the application after suspension, whether you run other commands or not, enter the c command.
To restart the application entirely rather than continue from the suspension point, enter the r command.
Use the list command to print a few lines either side of the current one to help you see what's going on.
When a breakpoint is hit, GDB will tell you which breakpoint triggered the suspension and print the current line:
1Breakpoint 1, main () at /home/smitty/microvisor-remote-debug-demo/demo/main.c:82282 debug_function_parent(&store);
Info
When you set a breakpoint early in your main() function, you may find that the application has already gone beyond that point. To restart the application so that it does hit that breakpoint, use this Microvisor API call:
1curl -s -X POST "https://microvisor.twilio.com/v1/Devices/${MV_DEVICE_SID}" \2--data-urlencode "RestartApp=true" \3-u ${TWILIO_ACCOUNT_SID}:${TWILIO_AUTH_TOKEN}
The STM32U585 microcontroller has a limit of eight breakpoints, but GDB will not inform you of this when you enter your ninth breakpoint. Instead, you will be warned when you continue to run the application:
1Warning:2Cannot insert hardware breakpoint 9.3Could not insert hardware breakpoints:4You may have requested too many hardware breakpoints/watchpoints.56Command aborted.
To remove a breakpoint, enter the clear command followed by the line number, file name and line number, or function name. Alternatively, you can enter d to delete all current breakpoints. GDB gives each new breakpoint a number and this number always increases in a session, even any or all breakpoints are deleted.
Info
When you quit GDB, breakpoints are lost. However, you can persist them with the command save breakpoints <FILENAME>. You can load them in during a future session with source <FILENAME>.
The bt command shows you the functions that were called, in sequence, to get the application to where it currently is. This is called a 'backtrace', and GDB presents it as a sequence of the frames added to the stack, one per function call. For example:
1(gdb) bt2#0 debug_function_child (vptr=0x2007ff98) at /home/smitty/GitHub/microvisor-remote-debug-demo/demo/main.c:1423#1 0x08001630 in debug_function_parent (vptr=0x2007ffac) at /Users/tsmith/GitHub/microvisor-remote-debug-demo/demo/main.c:1354#2 0x08001506 in main () at /Users/tsmith/GitHub/microvisor-remote-debug-demo/demo/main.c:74
If you add full after bt, you'll also get a readout of the variables that are currently in scope. For example:
1(gdb) bt full2#0 debug_function_child (vptr=0x2007ff9c) at /home/smitty/GitHub/microvisor-remote-debug-demo/demo/main.c:1583No locals.4#1 0x080012c0 in debug_function_parent (vptr=0x2007ffac) at /home/smitty/GitHub/microvisor-remote-debug-demo/demo/main.c:1475test_var = 436#2 0x08001184 in main () at /home/smitty/GitHub/microvisor-remote-debug-demo/demo/main.c:827status = MV_STATUS_OKAY8kill_tick = 09last_send_tick = 3000001110last_led_flash_tick = 5990663211tick = 6000001312close_channel = false13store = 43
GDB allows you to execute your application a line at a time to see the effect each one has on the application's state. To do so, suspend the application — manually or from a breakpoint — and enter the next command to execute the next line and then halt immediately afterwards.
If the next line to be executed contains a function call, next will call the function and stop at the next line in the current block. For example, in the following code, halted at line 82, next will halt at line 83:
182 debug_function_parent(&store);283 printf("Debug test variable value: %lu\n", store);
This is called 'stepping over' the function. If, however, you want to stop at the very next line to be executed, which may well be within the called function itself, use the step command. This is called 'stepping into' the function and, following the example above, will cause the application to halt at line 146:
182 debug_function_parent(&store);283 printf("Debug test variable value: %lu\n", store);384485 // No channel open? Try and send the temperature586 if (http_handles.channel == 0 && http_open_channel()) {6. . .7145 void debug_function_parent(uint32_t* vptr) {8146 uint32_t test_var = *vptr;9147 debug_function_child(&test_var);10148 *vptr = test_var;11149 }
Step again. Line 147 calls another function. If you don't care about what happens in debug_function_child() then you can use next to step over it. If you instead enter step, you'll step into debug_function_child() and halt at the function's first line.
A variation on step is stepi, which stops the application after the next machine code instruction, which is not necessarily the next line to be executed in the source code.
If you've stepped into a function and want to step back out of it, use GDB's fin (for "finish") command. This continues execution and has GDB halt again after the function has returned to its caller. It will also output any returned value. For example, if you've stepped into debug_function_parent() from main(), and then into debug_function_child(), the fin command will quickly get you back:
1(gdb) fin2Run till exit from #0 debug_function_child (vptr=0x2007ff9c) at /home/smitty/microvisor-remote-debug-demo/demo/main.c:1583debug_function_parent (vptr=0x2007ffac) at /home/smitty/microvisor-remote-debug-demo/demo/main.c:1484148 *vptr = test_var;5Value returned is $1 = true6(gdb) fin7Run till exit from #0 debug_function_parent (vptr=0x2007ffac) at /home/smitty/microvisor-remote-debug-demo/demo/main.c:1488main () at /home/smitty/microvisor-remote-debug-demo/demo/main.c:83983 printf("Debug test variable value: %lu\n", store);
When the application is suspended, you can view local and global variables' current values with the p command — follow it with a variable name. This will print the value of the requested variable. For example:
1(gdb) p store2$1 = 55
That's for a scalar value; for structured data you'll see the structure written out. For instance, if you set a breakpoint at line 335 and print resp_data when the app halts:
1(gdb) p resp_data2$3 = {result = MV_HTTPRESULT_OK, status_code = 200, num_headers = 25, body_length = 99}
If the code you're about to step through or run depends on the value of store, you can see how it reacts to different values by setting store's value at this point. To do, use the set command:
set store=100
You can then call c or step/next to execute the code that comes after the breakpoint.
For example:
1Breakpoint 1, main () at /home/smitty/microvisor-remote-debug-demo/demo/main.c:82282 debug_function_parent(&store);3(gdb) p store4$1 = 1135(gdb) set store=2006(gdb) n783 printf("Debug test variable value: %lu\n", store);8(gdb) p store9$2 = 201
You can set memory directly using GDB, which uses C-style operators to get a variable's memory location (&) as a pointer and to dereference (*) such a pointer. For example:
1(gdb) p tick2$1 = 9000403(gdb) p &tick4$2 = (uint32_t *) 0x20006360 <ucHeap+1000>5(gdb) set *((uint32_t *) 0x20006360) = 206(gdb) p tick7$3 = 20
If the variable you're printing is of a enum type, GDB will provide the correct constant value:
166 if (status == MV_STATUS_OKAY && tick - last_led_flash_tick > LED_FLASH_PERIOD_US) {2(gdb) p status3$1 = MV_STATUS_OKAY
You can get GDB to output the contents of the host microcontroller's registers with the info registers command:
1(gdb) info registers2r0 0x1d97d 1212133r1 0x8000 327684r2 0x19 255r3 0x40005400 10737633286r4 0x4040404 673720367r5 0x5050505 842150458r6 0x6060606 1010580549r7 0x200062e8 53689623210r8 0x8080808 13474407211r9 0x9090909 15158708112r10 0x10101010 26948814413r11 0x11111111 28633115314r12 0x7ff 204715sp 0x200062c8 0x200062c8 <ucHeap+848>16lr 0x8003b35 13423288517pc 0x8003b72 0x8003b72 <I2C_WaitOnFlagUntilTimeout+92>18xpsr 0x29000000 68786585619primask 0x0 020basepri 0x0 021faultmask 0x0 022control 0x2 223msp 0x2007ffc8 53739514424psp 0x200062c8 53689620025msplim 0x0 026psplim 0x20005f80 53689536027sfsr 0x0 028sfar 0xe000ede8 -53681000829shcsr 0x0 030hfsr 0x0 031cfsr 0x0 032bfar 0xe000ed38 -53681018433mmfar 0x0 0
Application crashes will be reported by GDB if and when they occur. For example:
1Program received signal SIGSEGV, Segmentation fault.20x08001a30 in start_iot_task (argument=0x0) at /Users/tsmith/GitHub/microvisor-iot-device-demo/App/main.c:2573257 *ptr = 45;
Use the r command to restart the application after checking variables, registers, and/or memory.
To end a debugging session, halt the application with Ctrl-C and enter the q command. You'll be asked if you wish to quit despite killing the application: enter y. GDB will exit to the command line, as will the Microvisor plugin.
The initial release of Microvisor's remote debugging functionality supports the majority, but not all, of the commands provided by GDB. Further commands are expected to be added as Microvisor progresses through its Beta phases, but some commands are not expected to be supported.
Not all features can be supported. For example, Microvisor has no awareness of or sensitivity to your RTOS' threads, so thread-specific information can't be relayed to GDB, and GDB can't provide thread-level control. This is also true for other embedded debuggers that have not been extended with RTOS-specific knowledge.
- Supported now
- Single-threaded debugging.
- Setting and removing breakpoints (
b,clear,delete). - Step in (
s). - Step over (
n). - Halting (Ctrl-C).
- Continuing (
c). - Printing/setting variables.
- Reading from/writing to RAM (
x). - Printing the backtrace (
bt). - Getting/setting registers.
- Support planned
monitorcommands, in particularmonitor resetandmonitor reset halt.
- Not expected to be supported
- Non-stop mode.
- Multiprocessing/multithreading control/debugging.
- The
loadcommand.
Microsoft's Visual Studio Code (aka VSCode) is a popular editor and IDE, and can be configured to provide a place to work on code and host remote debugging sessions. The remote debug demo repo can be used to sample remote debugging in VSCode, but you will need to perform a few setup tasks first.
Warning
This approach is supported only under Ubuntu running natively, but with some (unsupported) tweaks you can make it run on other platforms.
- Download and install VSCode.
- Run VSCode and click on the Extensions icon (the four squares) in the left-hand panel.
- Install the following extensions. You can use the search field at the top of the EXTENSIONS column to jump straight to each one:
-
C/C++ by Microsoft.
-
CMake by twxs.
-
CMake Tools by Microsoft.
-
Native Debug by WebFreak.
-
- Quit VSCode.
Open a Terminal and run:
sudo apt install gdb-multiarch
Clone our demo code repository:
git clone --recurse-submodules https://github.com/korewireless/Microvisor-Demo-Remote-Debug
The remote debug demo repo is set up to support remote debugging in VSCode: just open the repo's folder on your desktop and double-click the mv-remote-debug-demo.code-workspace file to launch VSCode and load in the config files you need.
-
Click on the Run and Debug icon in VSCode's left-hand panel:
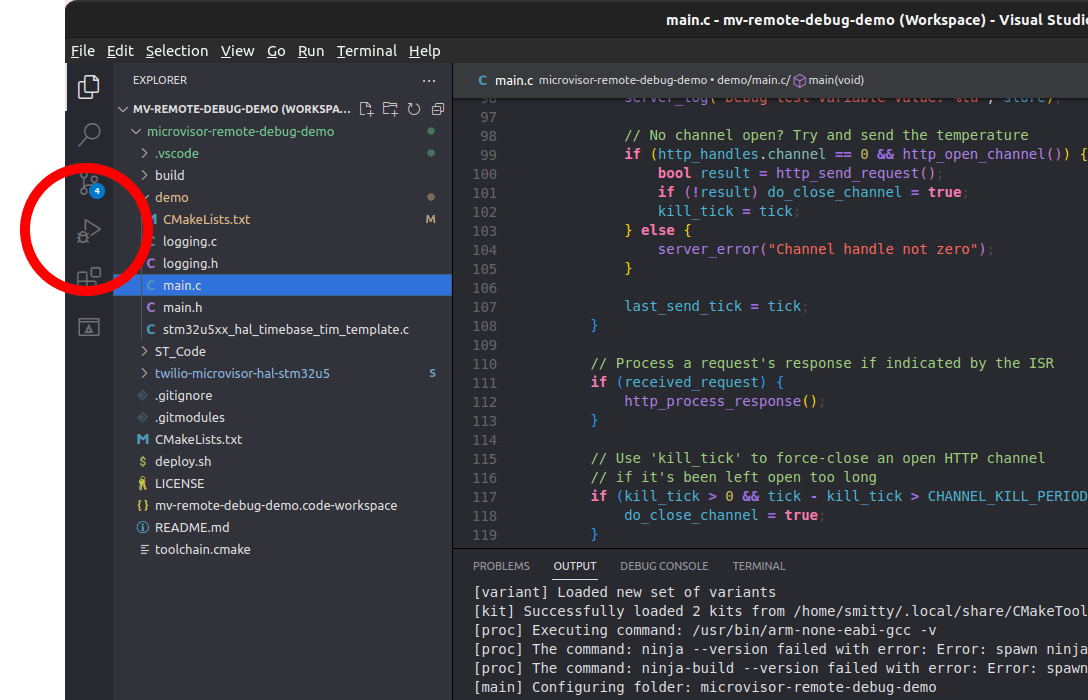
-
At the top of the Run and Debug column, you'll see Microvisor Remote. Click the play icon immediately to the left of this:
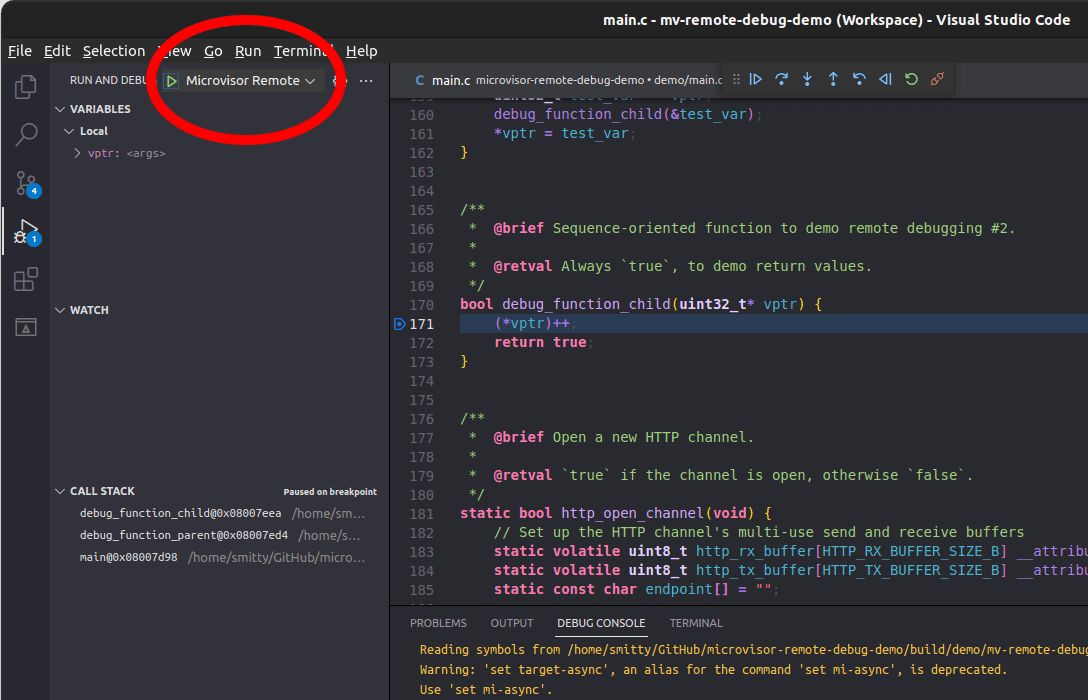
-
VSCode will show a Terminal in which you'll see debug keys being generated and then the app being built and deployed. There's a short delay between uploading and deployment, so we pause for 30s.
-
You should now see
GDB server listening on port 8001followed byAccepted connection from ::ffff:127.0.0.1:51254: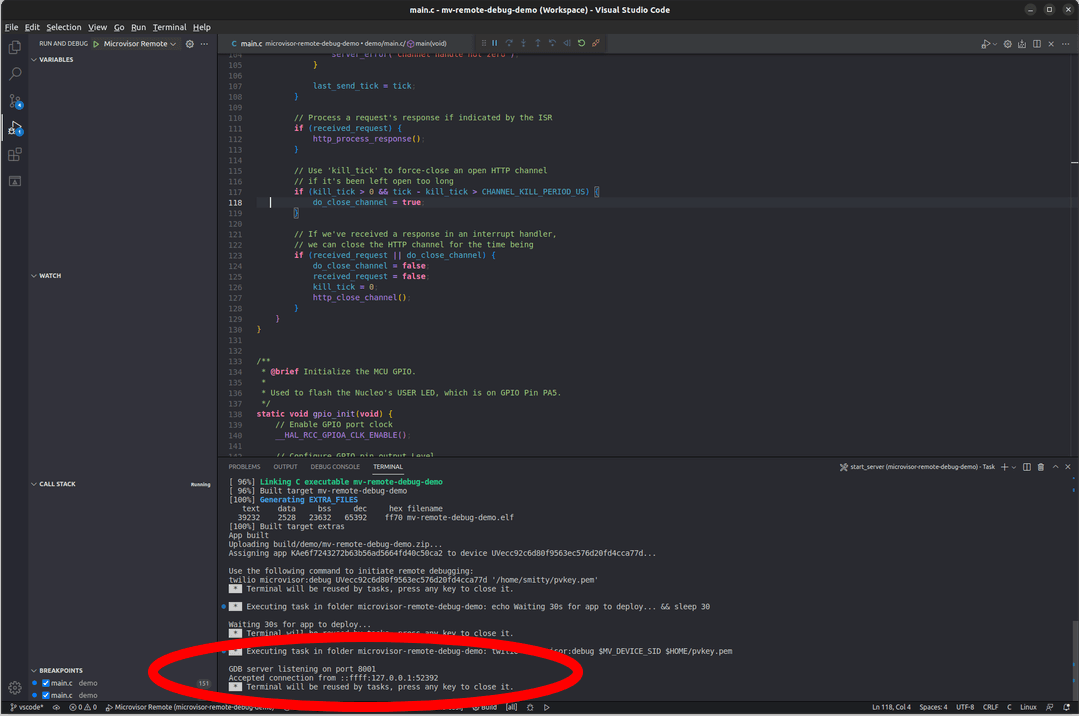
-
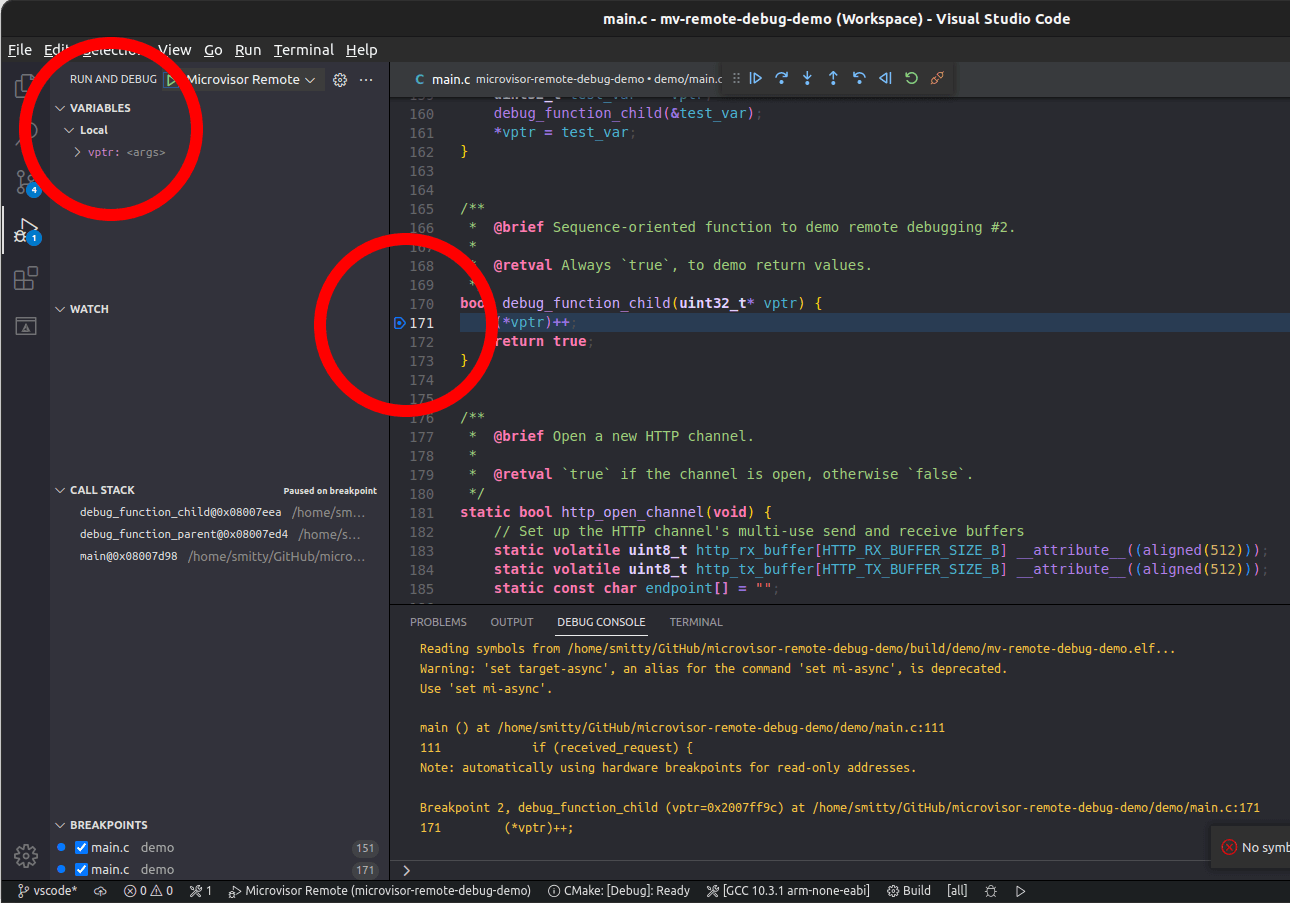
Switch to the DEBUG CONSOLE tab. Use the control bar at the top of the window to pause the program flow, step over or into functions, and continue running the code.
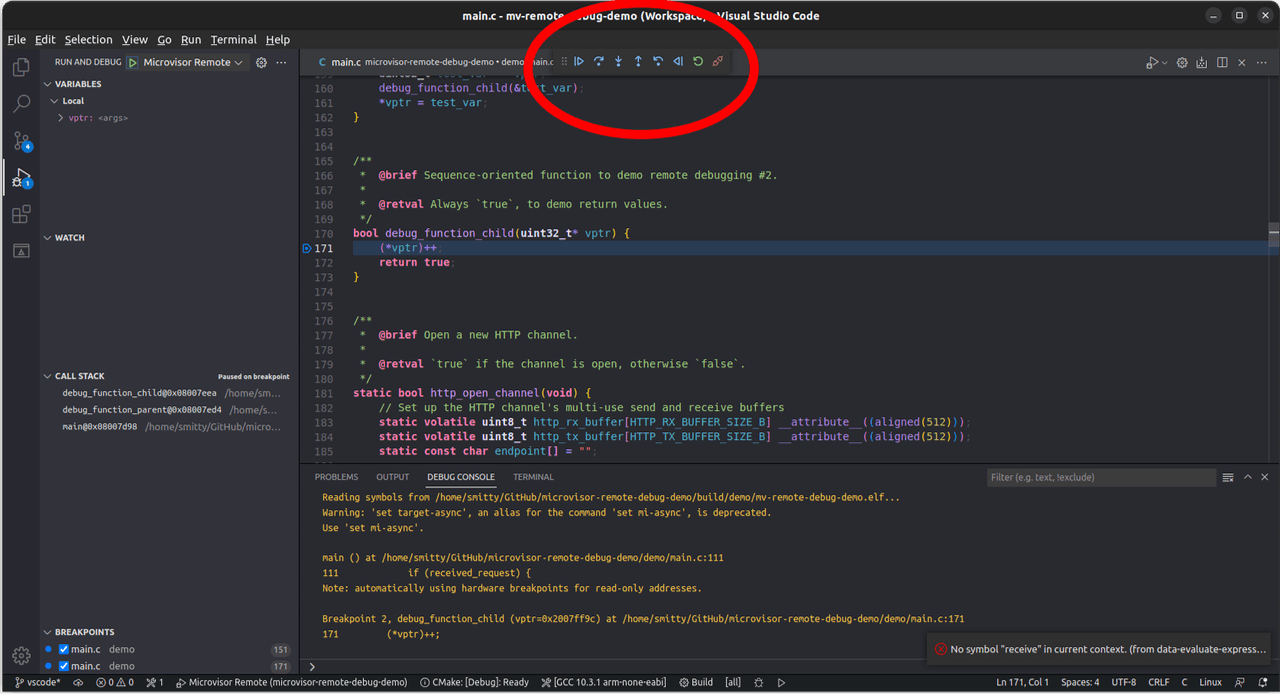
-
Set breakpoints by clicking alongside the line number in the main code pane. When a breakpoint is hit, local variables are listed in the Run and Debug column.
To run remote debugging sessions for your own Microvisor applications under VSCode, you need to create a .vscode directory in your own code repo then copy two files, launch.json and tasks.json, to this directory from the remote debug demo repo.
launch.json provides VSCode with the start-up information it needs when you initiate a remote debugging session (as in Step 2, above). The config file indicates which debugger to use and how to configure it. To avoid errors, the file explicitly tells gdb-multiarch to ignore local and other .gdbinit files (the --nx switch under debugger_args). Many of the keys in the configuration will be marked as not permitted if the Native Debug extension has not yet been installed.
tasks.json defines a series of pre-debugging actions that need to be performed in the order specified by the dependsOn key. These tasks are referenced by launch.json's preLaunchTask key. The tasks check the tools you need have been installed, generate debugging keys in your home directory, build the app and deploy to be debugged, allow time for deployment, and finally initiate the GDB server.
Most of these tasks call out to the Microvisor Plugin; one, build_app, uses the deploy.sh script so you will need to edit this task if you use an alternative build script.
Microvisor Help and Support
We welcome all inquiries you may have about Microvisor and its implementation, and any support questions that arise once you've begun developing with Microvisor. Please submit your queries via a KORE Wireless ticket: log in to the Kore console and click the Contact Support button in the left-hand navbar.