Conference Insights Dashboard
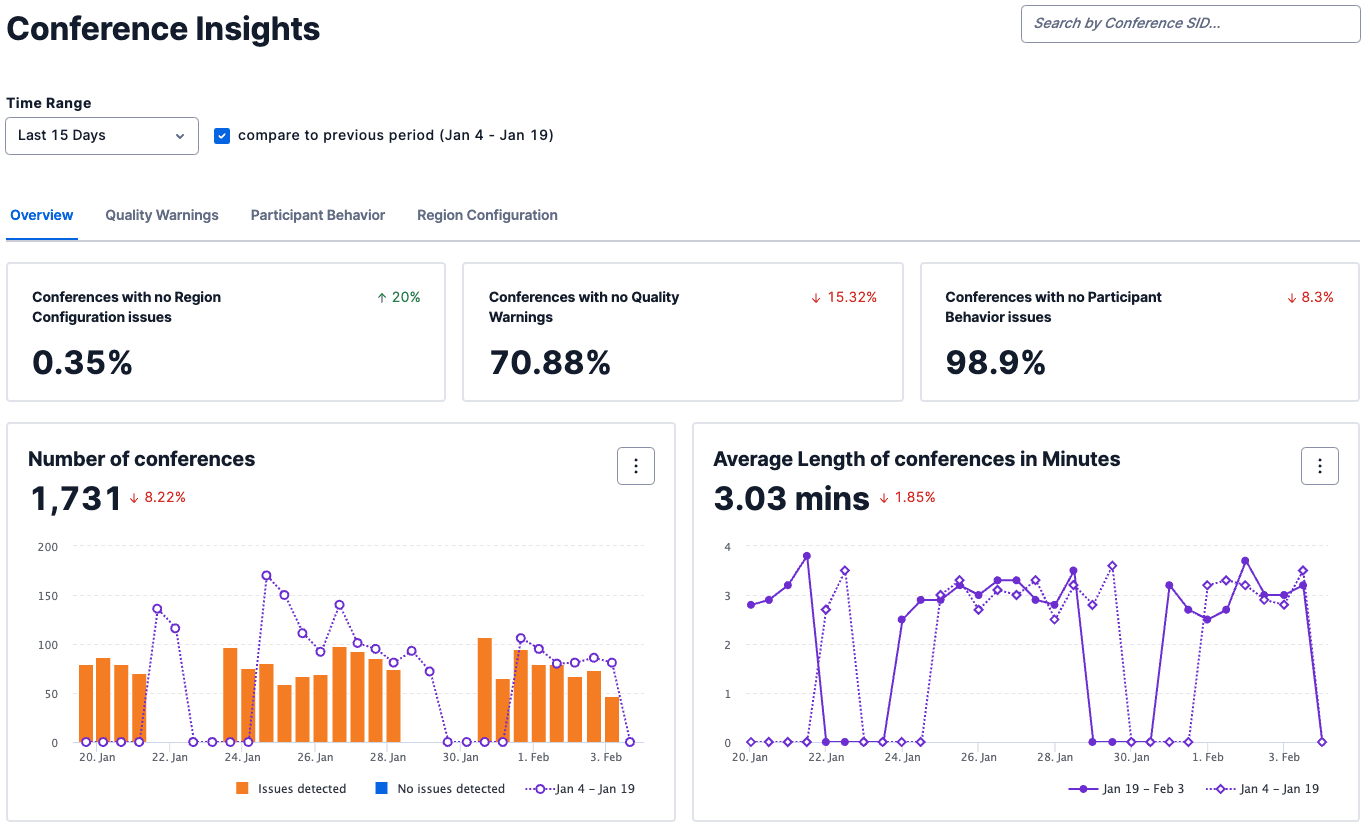
The Conference Insights Dashboard provides an account-level view of conference and participant behavior. Conference Insights Dashboard data is generated by analyzing and aggregating Conference Summary and Participant Summary records. Summarization is typically complete within 30 minutes of the conference ending.
To access the Conference Insights Dashboard in Twilio Console, go to Monitor > Insights > Voice > Conference. You can also find it in the legacy Console.
Conference Insights data is available for up to 30 days. Comparison trends for previous time frames are displayed for 1, 7, and 15 day views to show behavior trends. Trends can be disabled by clicking the checkbox next to the time range.
An individual conference SID can also be passed to the search field in the top right of the window to jump directly to the Conference Summary for the provided SID.
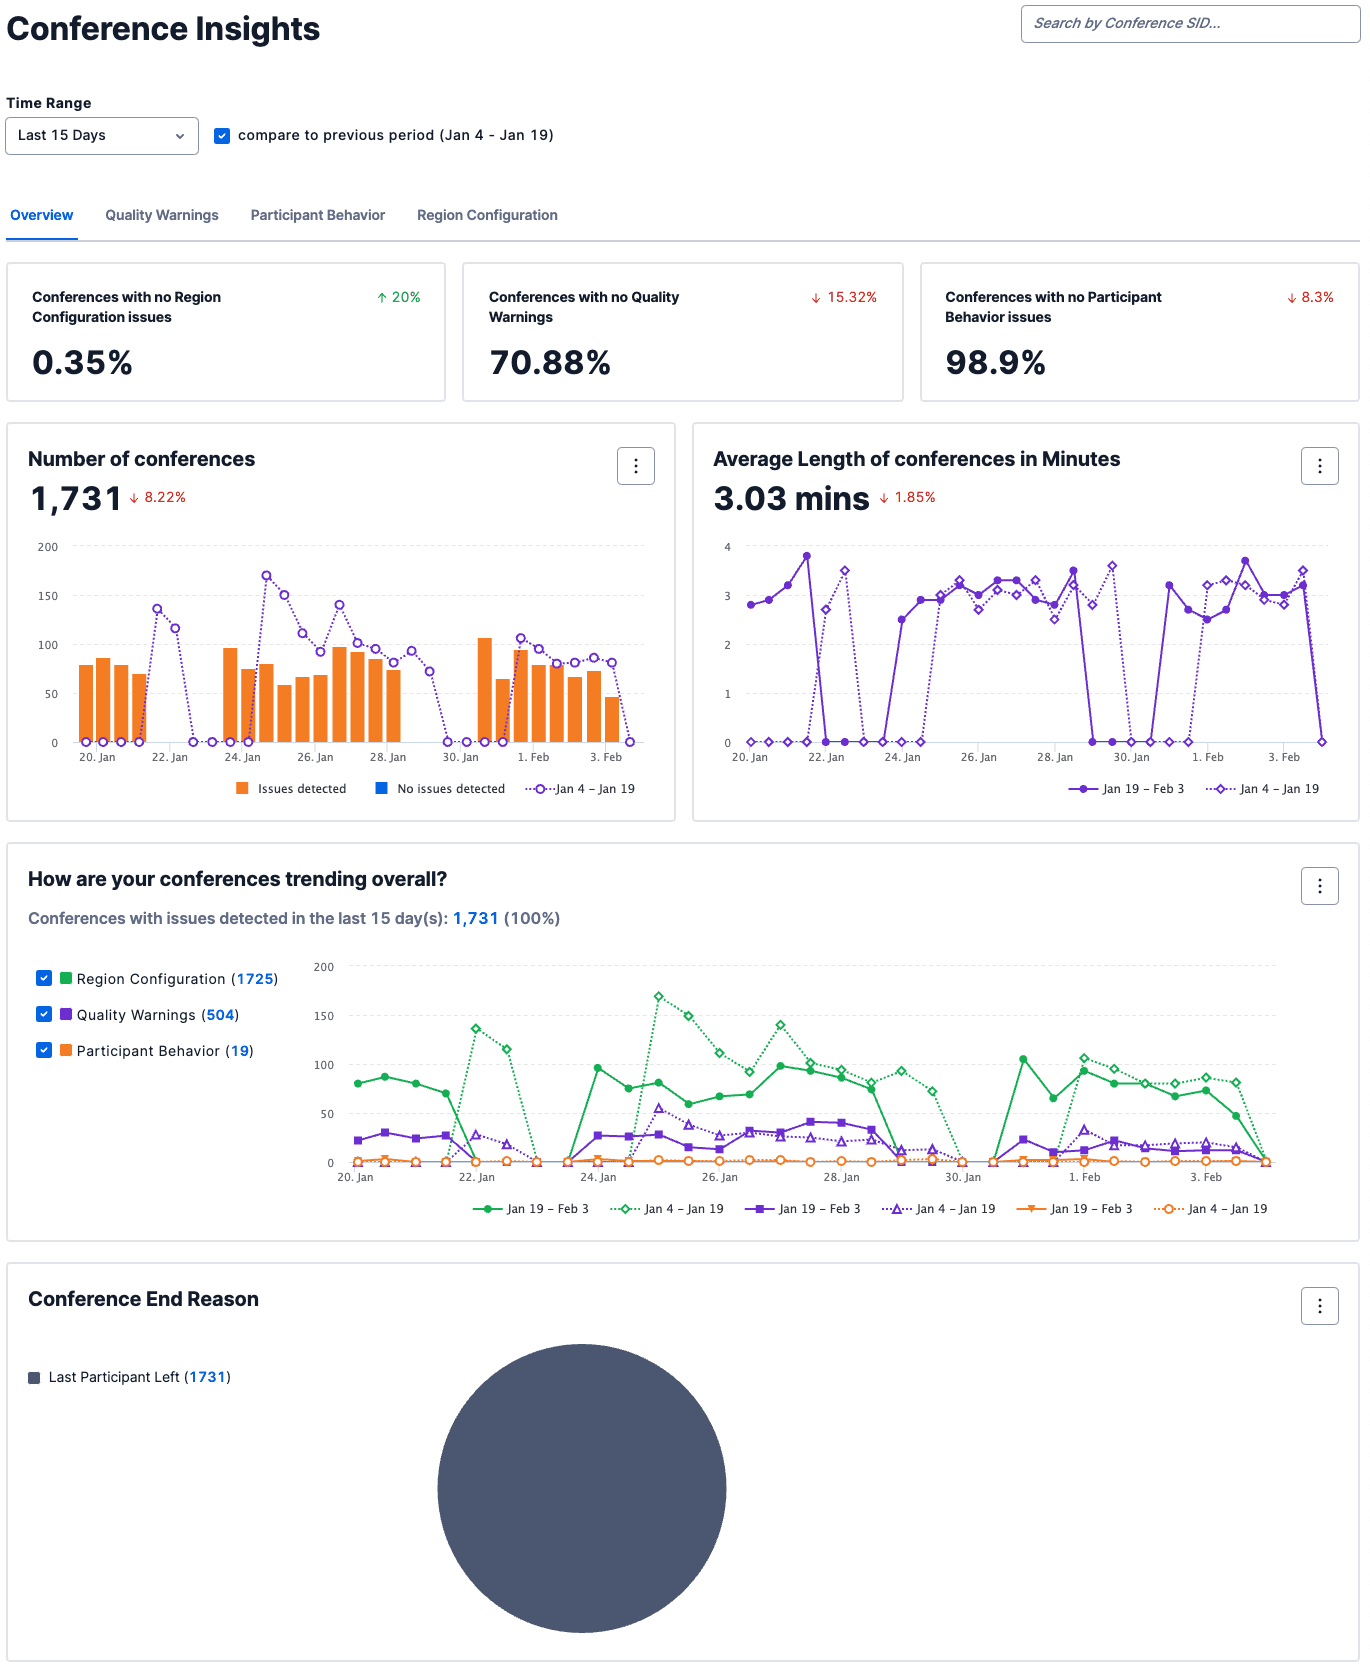
The Conference Insights Dashboard Overview tab displays high-level previews of data from the other tabs, volume and call length graphs, overall trends based on potential issues, and the distribution of conference end reasons for the timeframe.
'Detected Issues' and Your Application
Depending on your use case some of the behaviors captured by Conference Insights as Detected Issues may not actually indicate a problem for your application or your users.
For example, if your application hosts conference participants from all over the world, seeing a high percentage marked as Region Configuration issues is unavoidable since a conference can only be mixed in one region and in this use case participants will dial in from one or more of Twilio's media regions.
Twilio will still detect these conditions and display them in Conference Insights; however, if the behavior is expected for your application, you can safely ignore that condition.
| Section | Description |
|---|---|
| Conferences with no Region Configuration Issues | The percentage of conferences where the participants joined conferences that were configured in the same region that their media entered Twilio. |
| Conferences with no Quality Warnings | The percentage of conferences without detected choppy audio, robotic audio, or high latency. |
| Conferences with no Participant Behavior Issues | The percentage of conferences that started normally, did not have detected silent participants, and did not have multiple participants join with the same caller ID. |
| Number of Conferences | The volume of conferences over time. |
| Average Length of conferences in Minutes | The average length of conferences. Significant changes in the average length of conferences can be the result of call quality performance issues. |
| How are your conferences trending overall? | The performance of the various detected issue categories over time. Clicking on the number will take you to the list of conferences. |
| Conference End Reason | The distribution of why your conferences ended. Conferences can end due to programmatic instructions from the API, moderator activity, all participants leaving, or due to errors. |
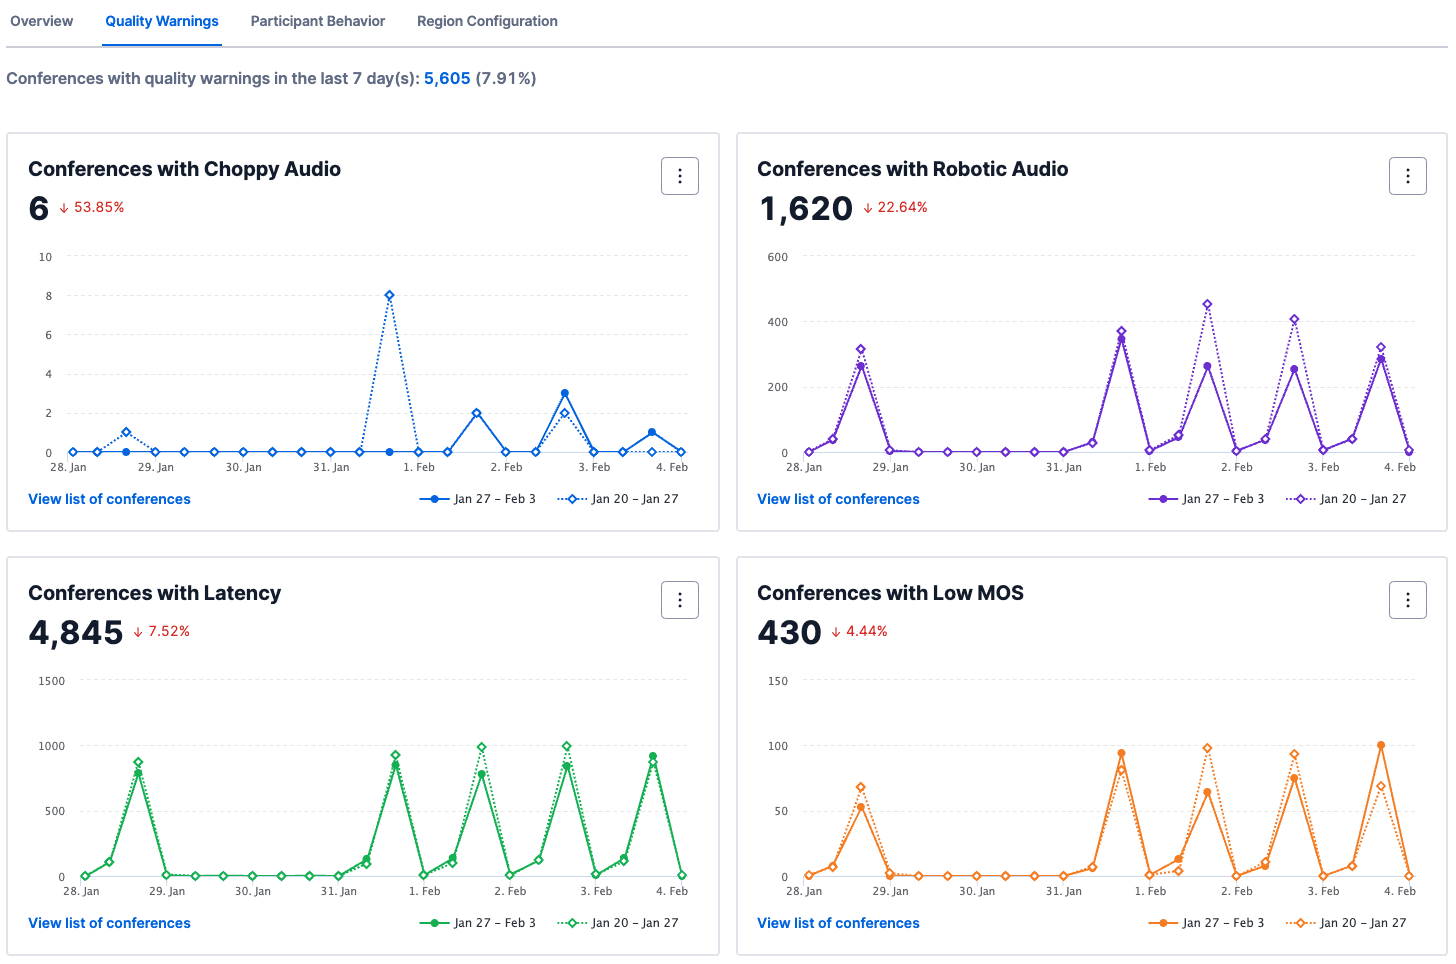
The Quality Warnings tab shows conference performance based on common audio degradation types caused by network transport. The threshold for categorization as a Quality Warning is tuned to detectable-but-tolerating; meaning we are trying to surface potentially noticeable degrading of the subjective experience for the participants but before the point of becoming frustrated/abandoning the calls. This is a deliberate threshold selection made so that you can identify mitigation strategies before users potentially start complaining.
Quality Warnings
Subjective experience is tough to capture with something objective like network transport metrics. Things like the jitter buffer size for a given participant, packet loss concealment performed by audio codecs, and browser-based heavy lifting to smooth out delivery of packets means at any given moment we can't know what the actual experience is for a caller. In the absence of this certainty, we start with ITU-T standards for VoIP quality as a baseline, and adjust the sensitivity down to try and reduce the perception of "false positives" while still providing useful visibility into the underlying performance of your/your user's networks.
Danger
All metrics are reported from the perspective of the conference mixer itself. For more information see Understanding Conference Media Paths.
| Section | Description |
|---|---|
| Conferences with Choppy Audio | Packet loss is expected packets that never arrive. This captures conferences where cumulative packet loss >5% was detected by the conference mixer. Packet loss is frequently described as choppy audio, but in extreme cases it can be reported as dead air, one-way audio, or dropped calls. |
| Conferences with Robotic Audio | Jitter is packets arriving out of order. This captures conferences where the average jitter is >5ms and the maximum jitter was at least 30ms as detected by the conference mixer. Jitter is commonly described as robotic, metallic, or noisy audio, but in extreme cases it can result in heavily distorted or unintelligible audio. The jitter buffer setting for the Participant can help smooth out the arrival of packets before they get played out to the other participants in the conference. |
| Conferences with Latency | Latency is how long it took for a packet to arrive at the destination from its source. This captures conferences where participant packets took >150ms to reach the conference mixer from the Twilio media edge. In some cases this can be due to geographic distance between the participant and the conference mixer; e.g. a Voice SDK participant registered in Singapore calling into a conference that is being mixed in Ireland. |
| Conferences with Low MOS | Mean Opinion Score (MOS) is a function that takes jitter, latency, and packet loss values as inputs and spits out a number between 1-5. MOS is a handy value to look at for at-a-glance understanding of overall call performance. Improving the MOS score can be accomplished by addressing the underlying jitter, latency, and packet loss performance. |
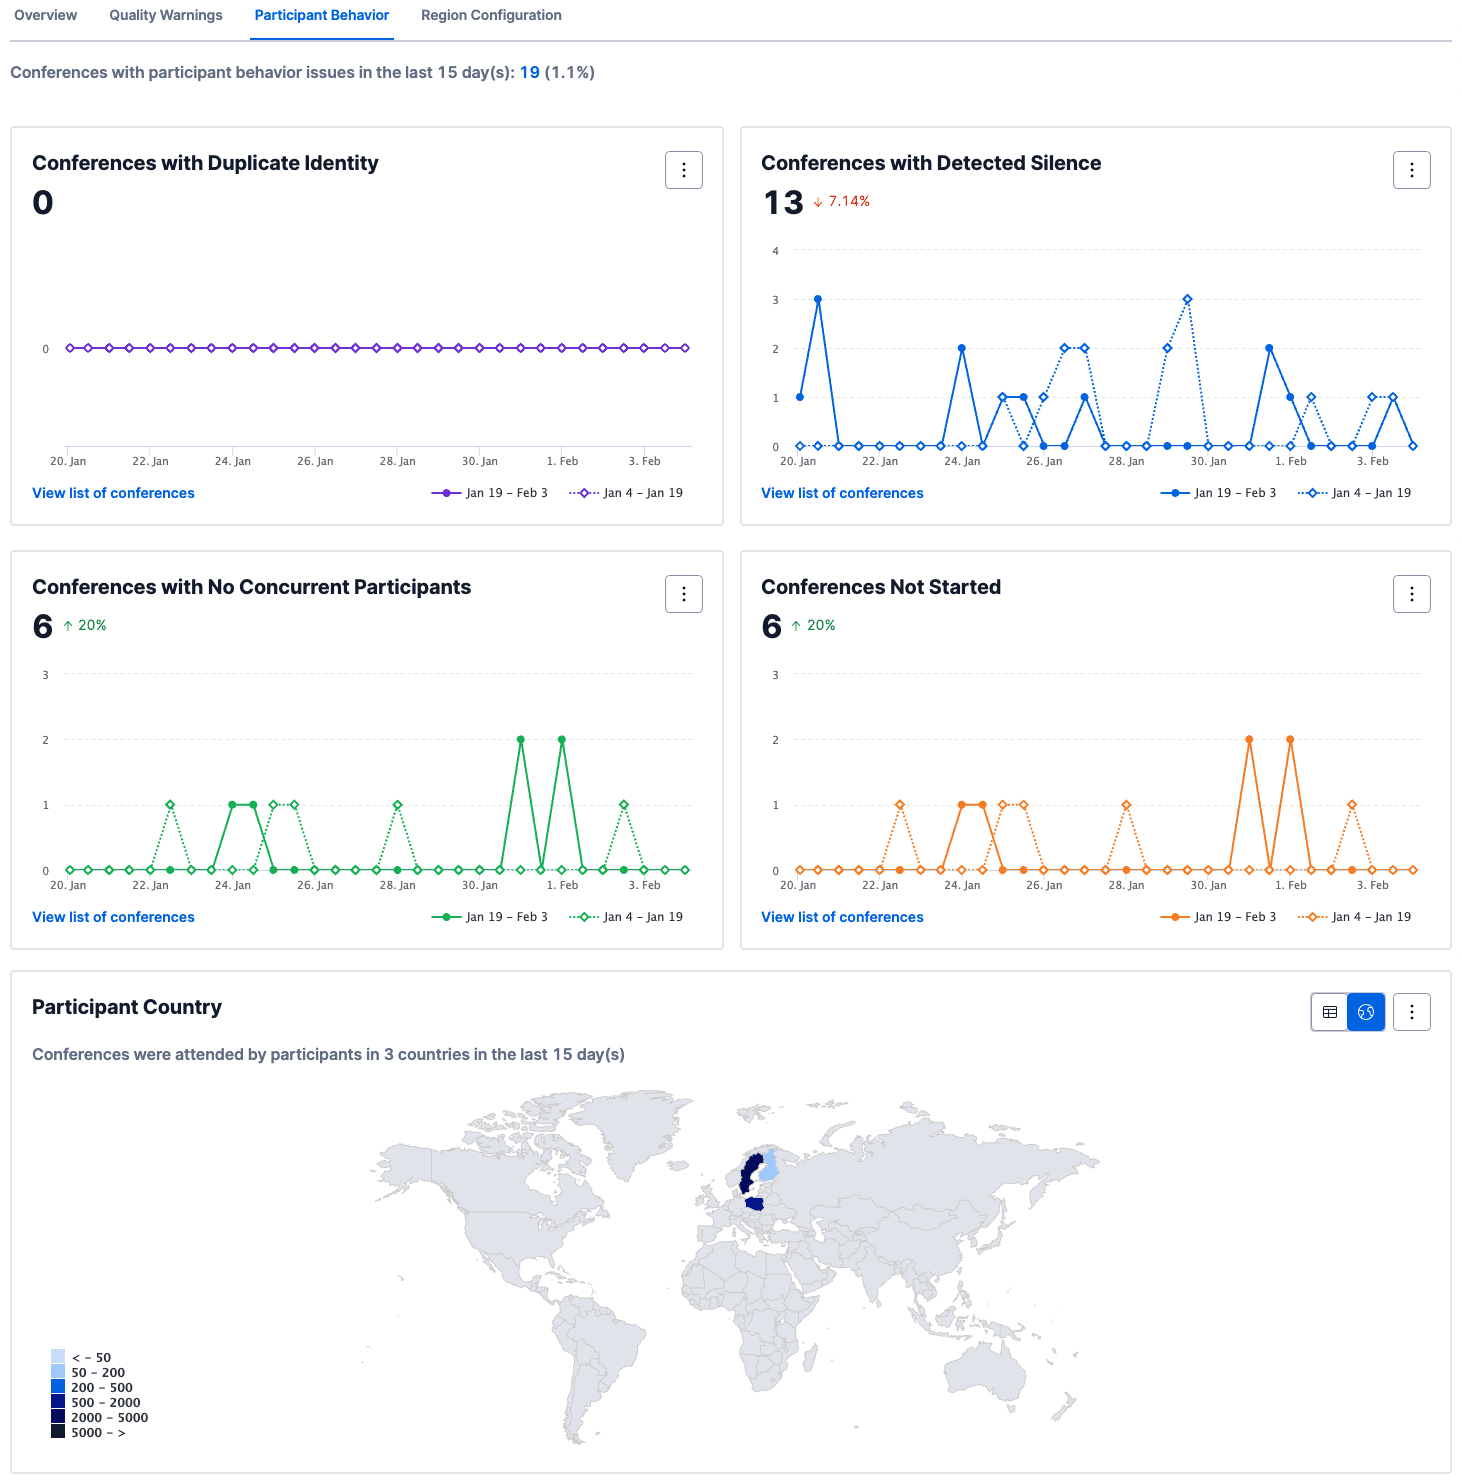
The Participant Behavior tab shows conferences that didn't start, conferences with participants who were silent, and conferences where the same caller ID is seen on multiple participants. You can also see the distribution of participants by country in tabular and displayed on a map.
Participant Behavior
Depending on your application, duplicate identity and silent participants may be expected. For example, in multiparty conferences with >=3 participants it is extremely common for participants to join and sit on mute for the entire duration of the conference; however, most Twilio conferences are two-party conferences where silence is generally not expected or desired. Similarly, if your application uses the same caller ID to add participants to conferences, or if you have participants joining from the same building, you may see duplicate identity detected and have it not represent a problem; however, duplicate identity can also help detect dropped calls, i.e. a participant is dropped from the conference and needs to dial back in.
| Section | Description |
|---|---|
| Conferences with Duplicate Identity | Conferences where the same caller ID appears for two or more participants. If not expected due to application design this can be an indicator of dropped calls. |
| Conferences with Detected Silence | Conferences where at least one participant was silent for the duration of their participation. If not expected due to use case this can be due to one-way audio or misconfigured firewalls. |
| Conferences with No Concurrent Participants | Conferences do not start until at least two participants join at the time. This shows conferences where at least two participants joined but were never in the conference at the same time. |
| Conferences Not Started | Conferences do not start unless at least one participant with moderator status joins; a moderator is defined as a participant with startConferenceOnEnter=true. This shows conferences where no moderator joined, and also includes conferences with no concurrent participants. |
| Participant Country | List view and map view of the conference participant distribution by country for this account for the given timeframe. |
Developers can either specify the region where a conference is going to be mixed, or allow Twilio to make that decision at runtime based on the conference participant population. Participant audio enters Twilio from one of our media edges, and there can be significant distances between a participant's audio ingress and the conference mixer, which can introduce latency.
Region Configuration
Depending on your call flow, it may not be possible to optimize the region selection. For example, if one participant is calling from Singapore and another from Germany there is no way the conference region selection could avoid having participants join from outside the mixer region.
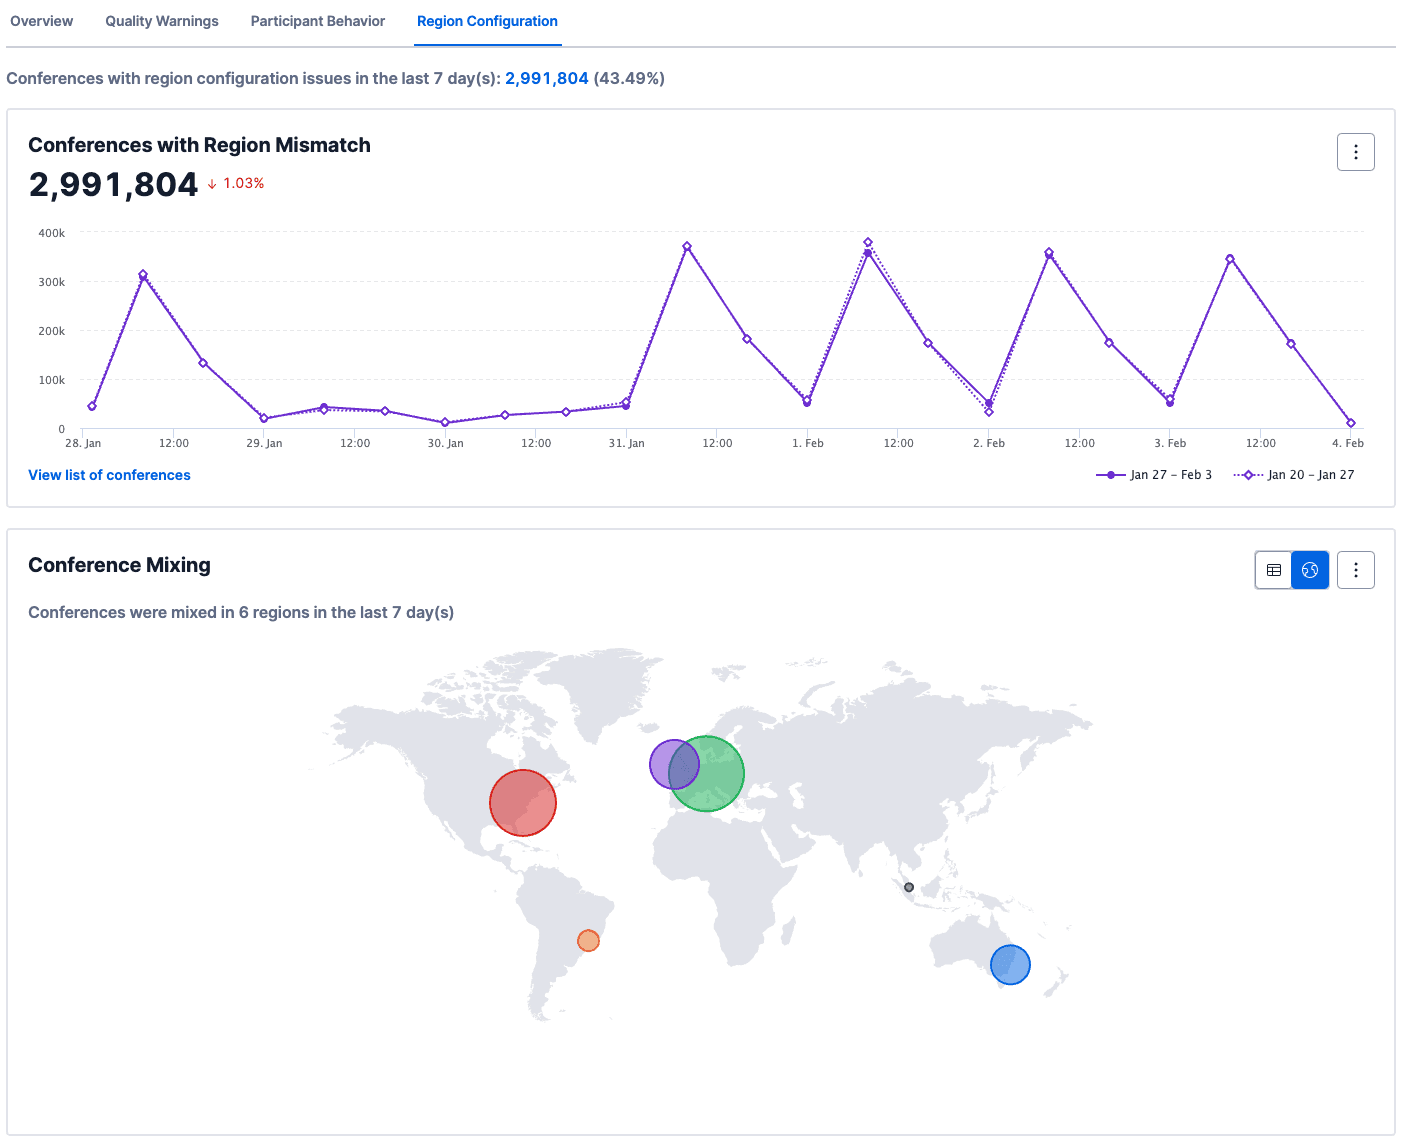
| Section | Description |
|---|---|
| Conferences with Region Mismatch | Conferences where the selected mixer region is different from the media region of the participants. Depending on your call flow, it may not be possible to optimize the region selection. For example, if one participant is calling from Singapore and another from Germany there is no way the conference region selection could avoid having participants join from outside the mixer region. |
| Conference Mixing | List view and map view of the distribution of conferences by mixer region. |
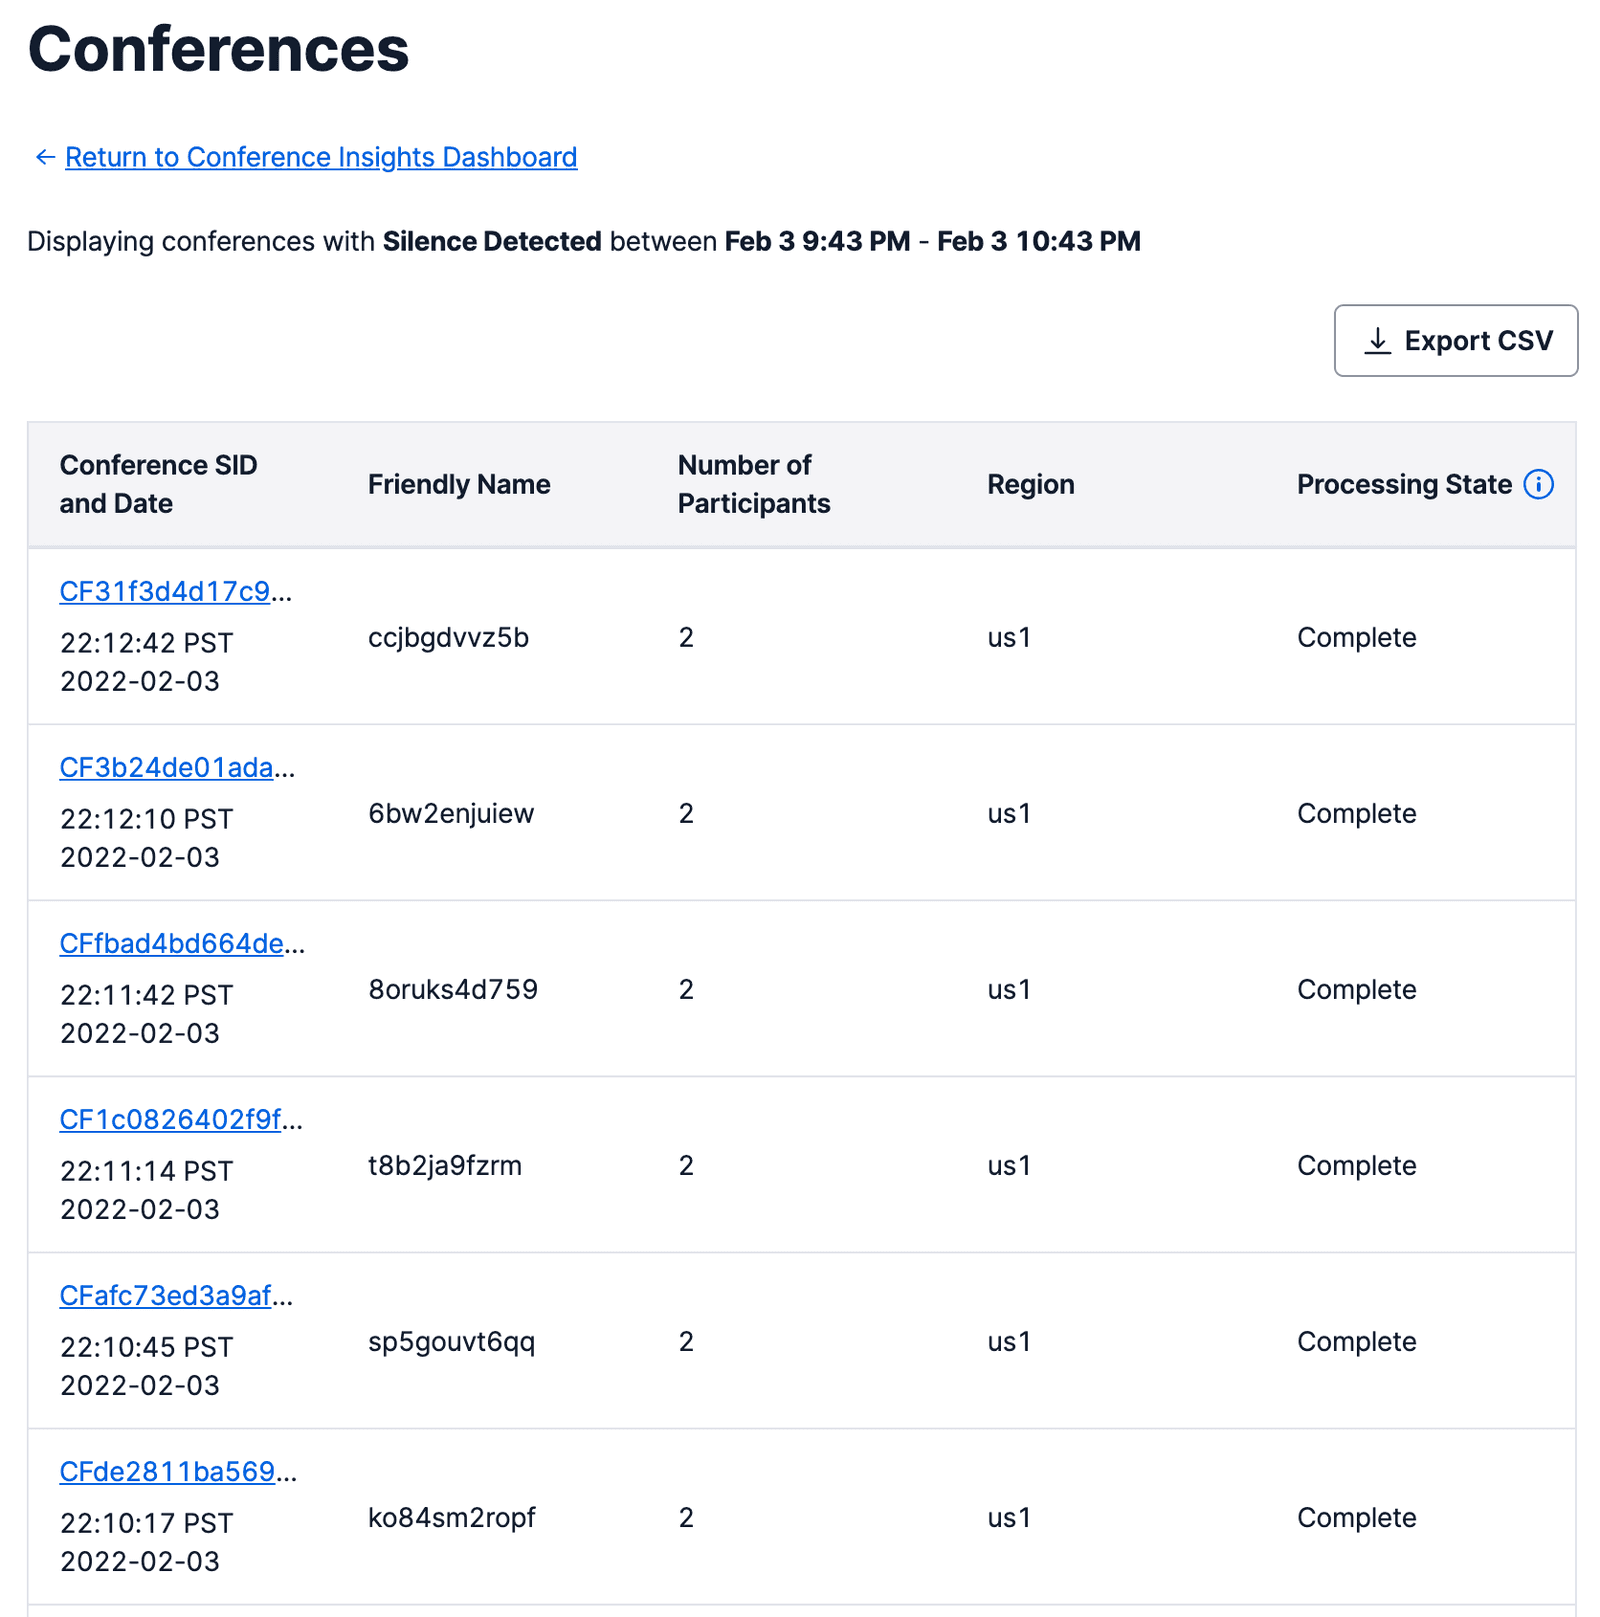
Clicking on the View list of conferences links on the Conference Insights Dashboard will bring you to the Conference List view. This shows a list of conferences that displayed the detected behavior. The list can also be exported to CSV for offline analysis.
If you're familiar with Voice Insights Call Summaries and Metrics, you may already understand the concept of the media edge. When viewing the metrics captured in the participant summary records it is helpful to think of them as being from the perspective of the conference mixer; i.e. what a given participant sent to or received from the mixer. This means that you can map the path of media through the Voice Insights Call Summary and Metrics and Conference Insights Participant Summary as illustrated below.
