Working with Custom Metrics in Insights
Public beta
Flex Insights (also known as Historical Reporting) is currently available as a public beta release and the information contained in the Flex Insights documentation is subject to change. This means that some features are not yet implemented and others may be changed before the product is declared as generally available. Public beta products are not covered by a Twilio SLA.
Any reference to "Historical Reporting", "Flex Insights API", "Flex Insights Historical Reporting", or "Flex Insights Historical Reporting API" in the Flex Insights documentation refers to Flex Insights.
If you are creating Insights reports that do not include built-in metrics, you might need to build a custom metric. You can write MAQL query (Multi-Dimension Analytical Query Language) from the Analytics Portal using the Advanced Metric Editor to create custom metrics.
This page provides an overview of building your custom metrics. We'll cover:
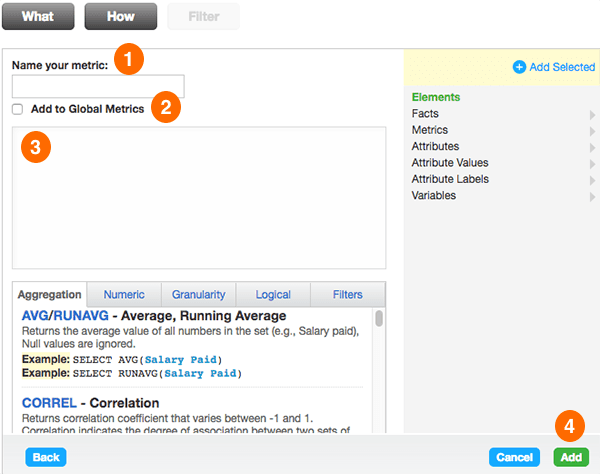
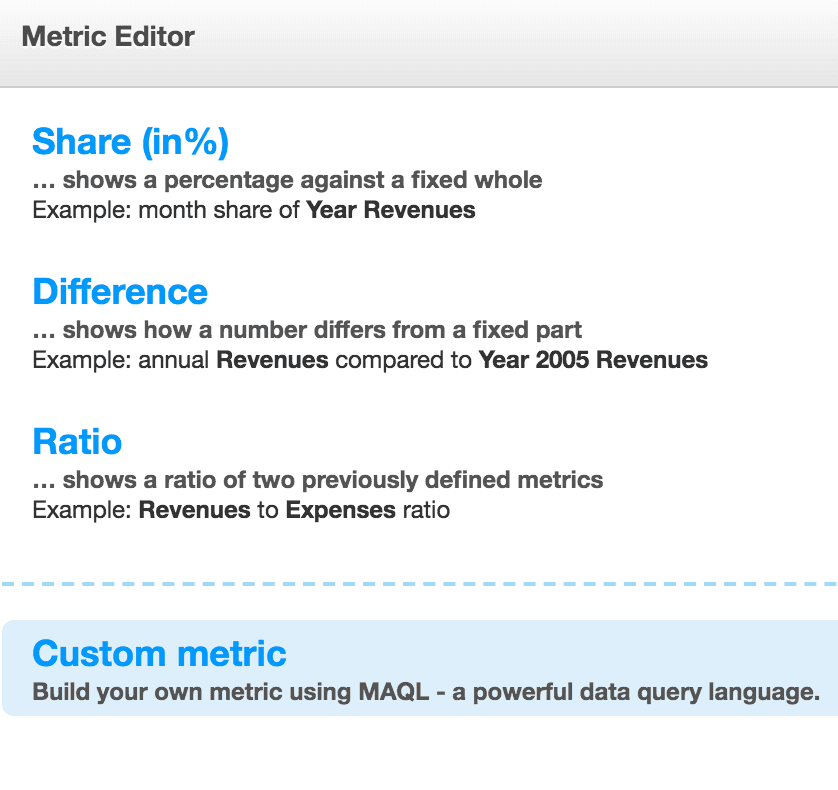
After you click Custom metric, you will be redirected to the Advanced Metric Editor as shown below.

-
Enter a name for your metric in the Name your metric text box.
-
Check the Add to Global Metrics box to access your metric in any of your reports. If you want the metric to only be available in the current report, leave this box unchecked.
If you check Add to Global Metrics, choose a folder to store the metric in. You can then edit the format of your metric in the Format string box. You can define how you'd like numbers to be formatted when you save a global metric - see more on metric formatting here.
-
Enter your MAQL query into the Editor pane. If you are not familiar with writing MAQL in the Editor pane, see the section below on using the editor pane.
-
Click Add.
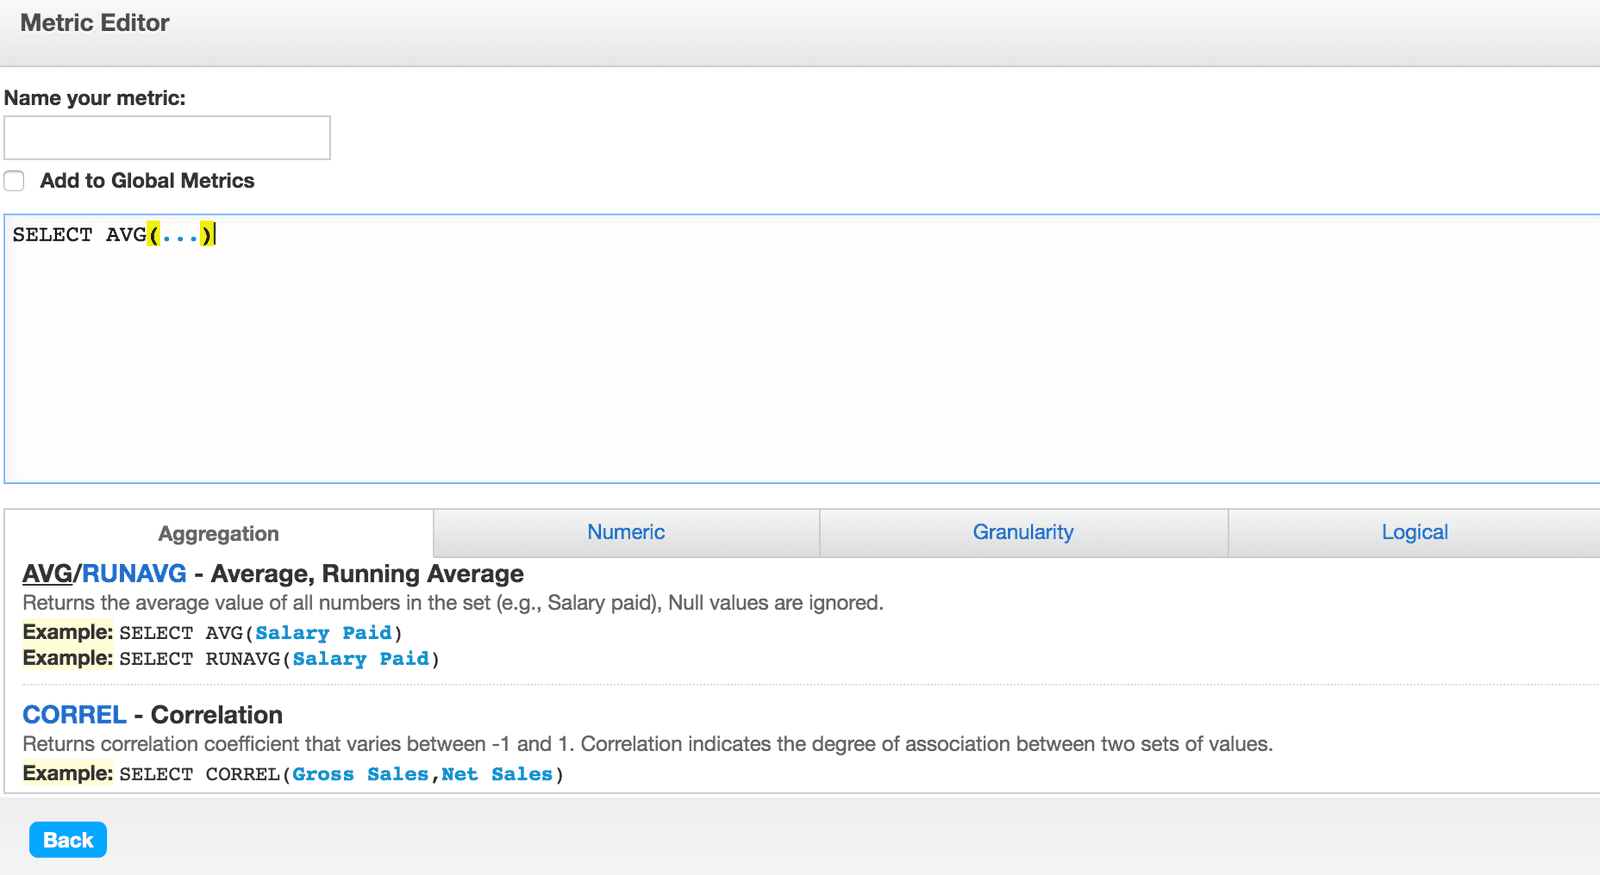
In the Editor pane, you can write your MAQL to build your custom metric. All metrics begin with SELECT.
Below the Editor pane, there is a list of functions you can apply to the facts, metrics, and attributes in your metric. Each function contains a definition, and you can click on a function to add it to your report:

You cannot directly type in your facts, metrics, and attributes into this editor pane, but instead must select from the Elements menu.

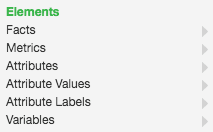
The Elements menu contains the following folders:
- Facts: Raw numbers from your data
- Metrics: Existing queries over facts
- Attributes: Date and text fields
- Attribute Values: A choice for an attribute. For example, the attribute Kind attribute can contain attribute values such as Queue, Conversation, Agent Status, etc.
- Attribute Labels: The name of the attribute field. Attributes like Handling Team contain multiple labels - Handling Team Id, Handling Team Name and Handling Team Hierarchy Name.
- Variables: These permit metrics to be dynamic, based on the data threshold or user who is viewing the metric.
- Click on the folder containing the element you would like to add.
- Choose the element or elements to add.
- Click the + Add Selected button at the top of the panel or double-click the element.
Once an element is added to the custom metric formula, it will automatically be color-coded in the following way:
- Facts: blue
- Metrics: green
- Attributes and attribute labels: purple
- Attribute values: orange
- Variables: light brown
Please reference our document on the Analytics Data Model for a full list of Flex Insights data points.
Warning
If you click the green Add button at the bottom of the report, you will receive an error message. The Add button is for adding the completed metric, not adding an element.
For a custom metric to work, you must choose your metrics and attributes from the Elements panel. Typing out element names or copying and pasting from a different source will not be successful.
This formula is incorrect (a copied and pasted formula):

The formula below uses the Elements menu to add objects. This formula is correct:

If you are creating a query that is more complicated than a single aggregated action, you should pay attention to parentheses usage and make sure that sub-queries are appropriately nested:

If your query contains any missing parentheses, you won't be able to save the metric:

If you are creating a complicated custom metric, it might be easier to split your custom metrics into pieces.
The most common mistake in custom metrics is syntax errors. It can happen that instead of selecting the "Yes" value from "Abandoned" attribute you select the "Yes" value from another attribute, for example, "Productive."
While visually the formula will look identical in both scenarios, you may receive a red error message when clicking the Add button at the bottom of the editor indicating that you chose the value from a wrong attribute:


