Using the Source Debugger
The Source Debugger is a real-time tool that helps you confirm that API calls made from your website, mobile app, or servers arrive at your Segment source. Use it to validate that your implementation is working, test that events fire in the correct format, and troubleshoot issues without waiting for data to process through your pipeline.
To open the Debugger for a source:
- Go to Connections > Sources.
- Select the source that you want to debug.
- Click the Debugger tab.
The Debugger displays a live stream of events arriving at your source in real time. You'll see events as they arrive, making the Debugger ideal for quick validation of your implementation.
The Debugger shows sampled events as they come in (up to 500 events). Each event includes the event name, timestamp, and a summary of the data sent.
Info
The Source Debugger shows a sample of events in real time and confirms incoming data. It's not an exhaustive view of all events sent to your source, and event order in the Debugger may not reflect how events are ordered downstream or received by connected destinations. For a reliable, complete record of all events, set up a Warehouse or Amazon S3 destination.
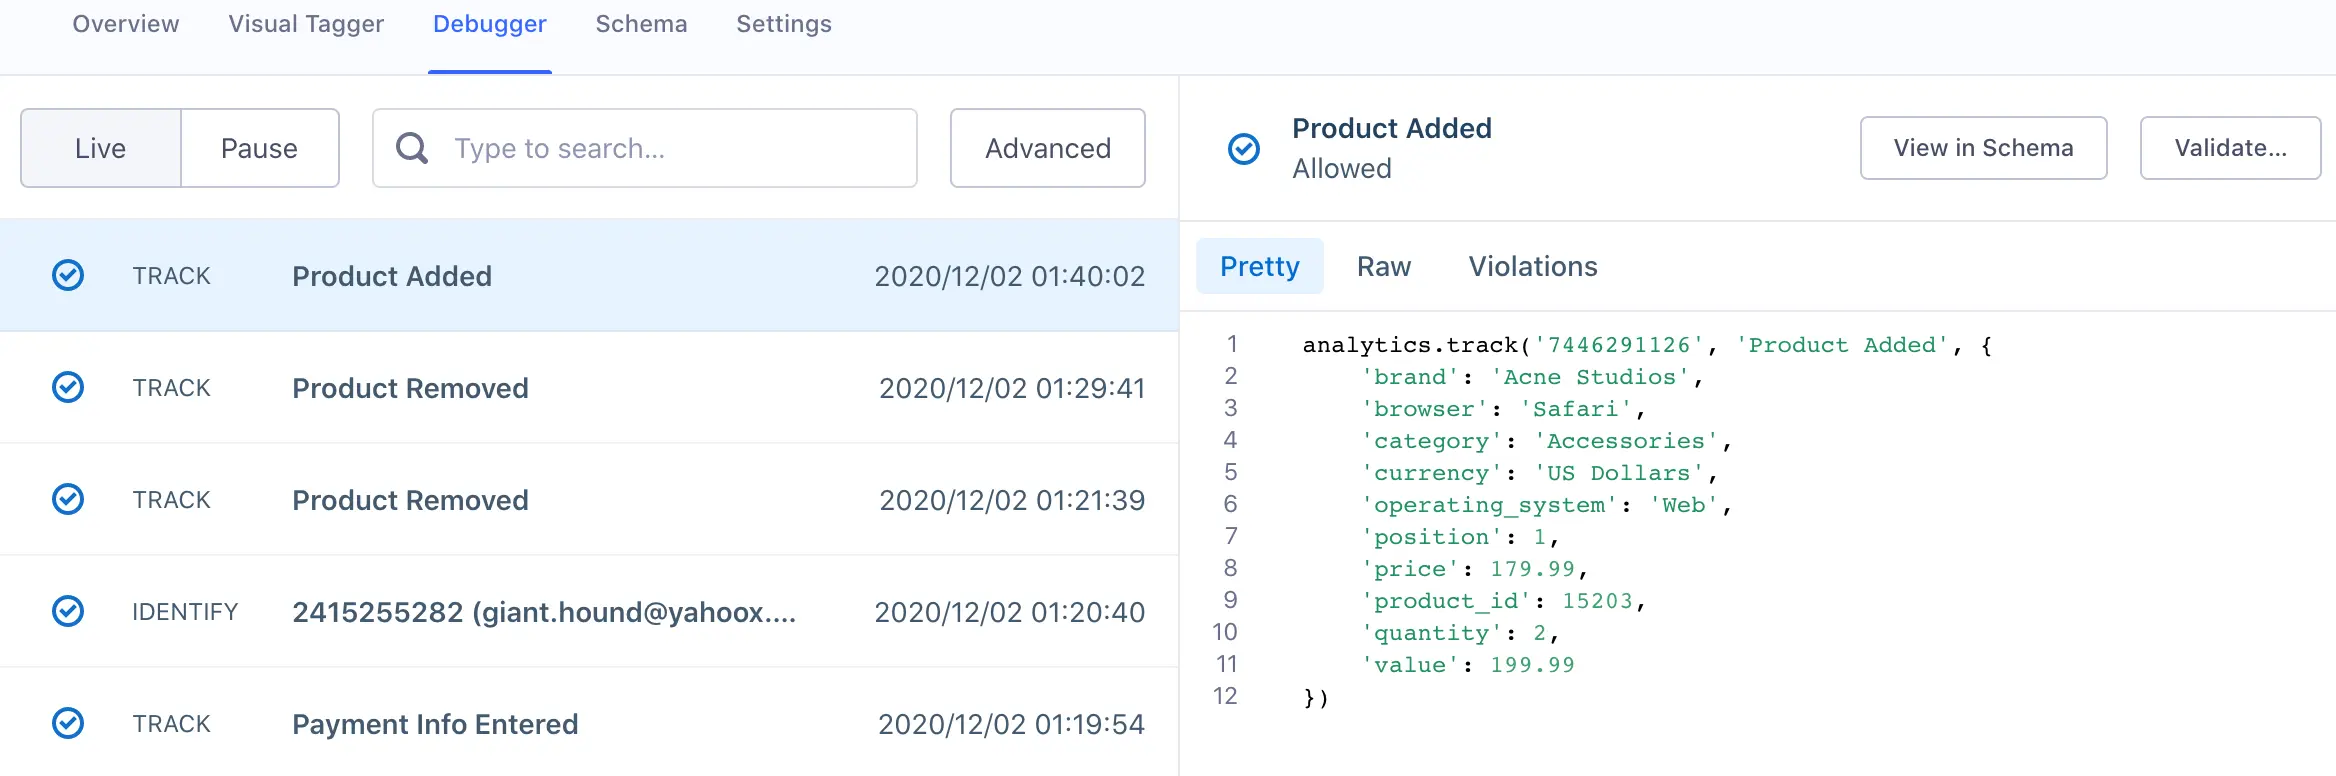
By default, the Debugger streams live events. You can do the following:
- Pause the live stream by toggling Live to Pause to examine events more closely. Events continue to arrive at your source during this time.
- Resume the stream by toggling back to Live.
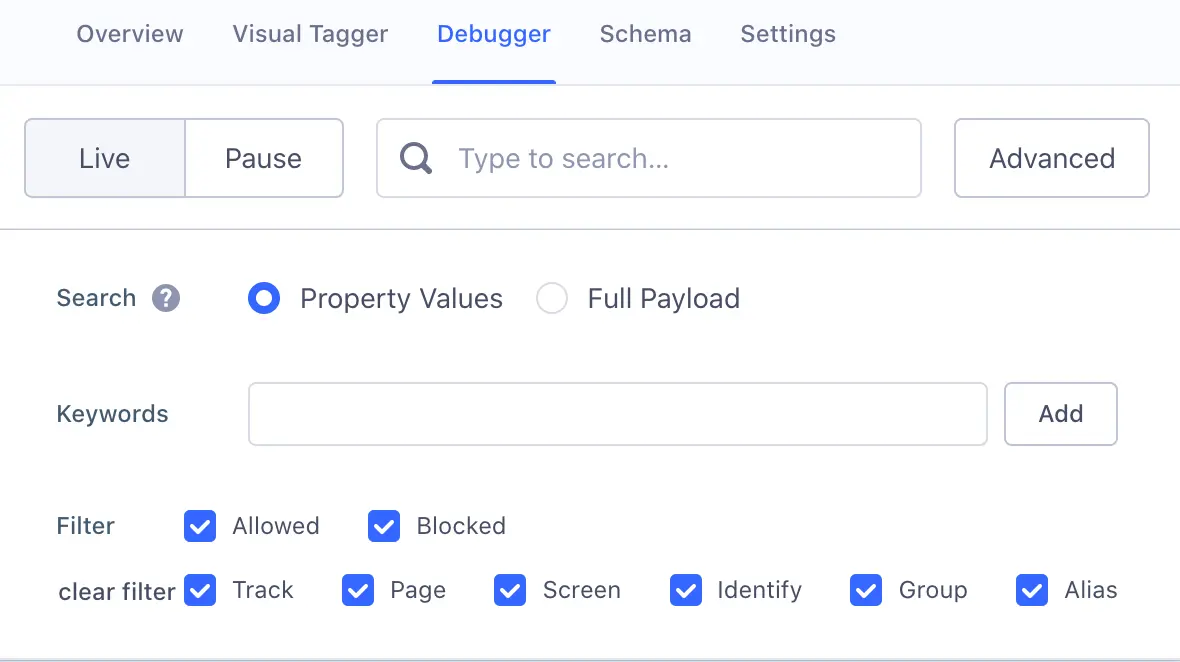
You can search the Debugger to find specific payloads using any information that you know is in the event. Use the search box to filter by event name, user ID, or any property that you included in the event.
You can also use advanced search options to limit the results to a specific event.
When you select an event, two views are available to inspect the payload. Click the Pretty or Raw tab at the top of the event detail panel to switch between views.
The Pretty view shows a simplified version of the API call that you made. This view helps you verify that your event structure looks correct at a glance. Use this view for the following checks:
- Confirming that the event name matches what you intended.
- Verifying that important properties are present.
- Checking that user identification (user ID or email) was captured.
The Pretty view format depends on the library that you're using. It may not show every field or configuration setting, since it's a simplified representation of your call.
The Raw view displays the complete JSON object that Segment received, including all the details about what was tracked: timestamps, properties, traits, user IDs, and contextual information that Segment automatically collects. This view is useful for the following tasks:
- Verifying that all fields (including optional ones) are being sent.
- Debugging missing or incorrectly formatted properties.
- Checking automatically-collected context like device, OS, or timezone.
Use this view when you need to verify the complete data structure that Segment received.